
HYDROLOGY & EARLY WARNING / DECISION WORKSPACE
Turn upstream catchment weather into calibrated river foresight.
An integrated hydrological suite for river sensor networks, digital twins, and flood warning systems — calculating upstream tributary rainfall, verifying numerical forecast models, predicting surge lag, and screening sensor confidence before sirens trigger.
FROM CLOUD TO CREST
Five connected capabilities.
One operating picture.
Downstream river crests do not wait for radar. Basin Intelligence links rolling upstream rainfall to downstream gauge observations, while surfacing telemetry freshness, calibration needs, and uncertainty so operators can judge what supports each estimate.
01Monitor upstream tributary rainfall in rolling windows
→ 02Verify 48-hour model accuracy & pinpoint miss zones
→ 03Calibrate river surge crest & time-to-peak lag
→ 04Screen telemetry health before sirens trigger
→ 05Map post-flood extent for civil review & reporting
THE BASIN INTELLIGENCE TOOLKIT
Choose the hydrological capability
you need to deploy.
Open any module for its operational workflow, example scenarios, required input streams, API request payload, and capability boundaries.
 01 / BASIN MODULE↗
Catchment rainfall APIAVAILABLE · GET & POST ENDPOINT
How much rain has fallen upstream of each river gauge—and how much is coming in the next 3, 6, 12 and 24 hours?
Observed and forecast rainfall totals for the area upstream of each river sensor, broken down by tributary sub-catchment across rolling 3, 6, 12, 24 and 48-hour accumulation windows. Blends Tomorrow.io precipitation radar with numerical weather grids.
Explore module ↗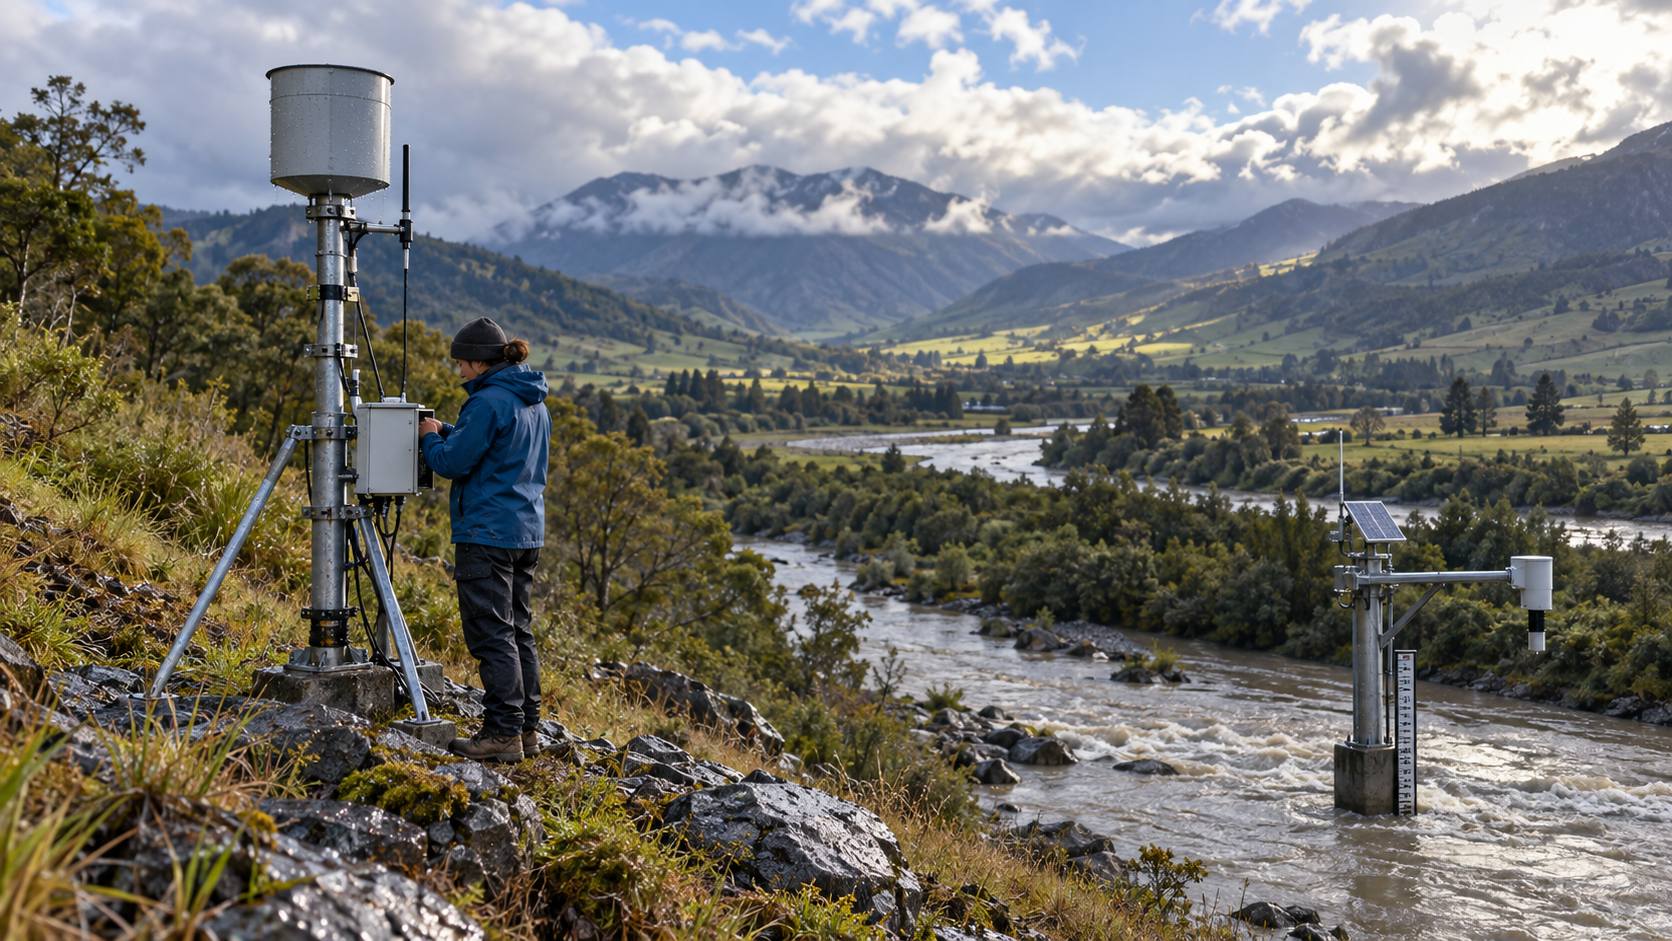 02 / BASIN MODULE↗
Rainfall forecast verificationAVAILABLE · GET & POST ENDPOINT
Where are our numerical weather forecasts repeatedly under-predicting or over-predicting rain?
A continuous verification record of what each weather forecast predicted, what later occurred at the catchment level, and where models repeatedly miss heavy rain. Assess and improve existing 48-hour numerical models.
Explore module ↗ 03 / BASIN MODULE↗
River response APIAVAILABLE · POST ENDPOINT
How high will the river rise at our gauging sensor—and exactly when will it crest?
A calibrated estimate of how rainfall in different upstream sub-catchments translates to later stage rises and discharge at river sensors. Features time-to-peak lag, crest surge height, and an explicit 90% confidence uncertainty envelope.
Explore module ↗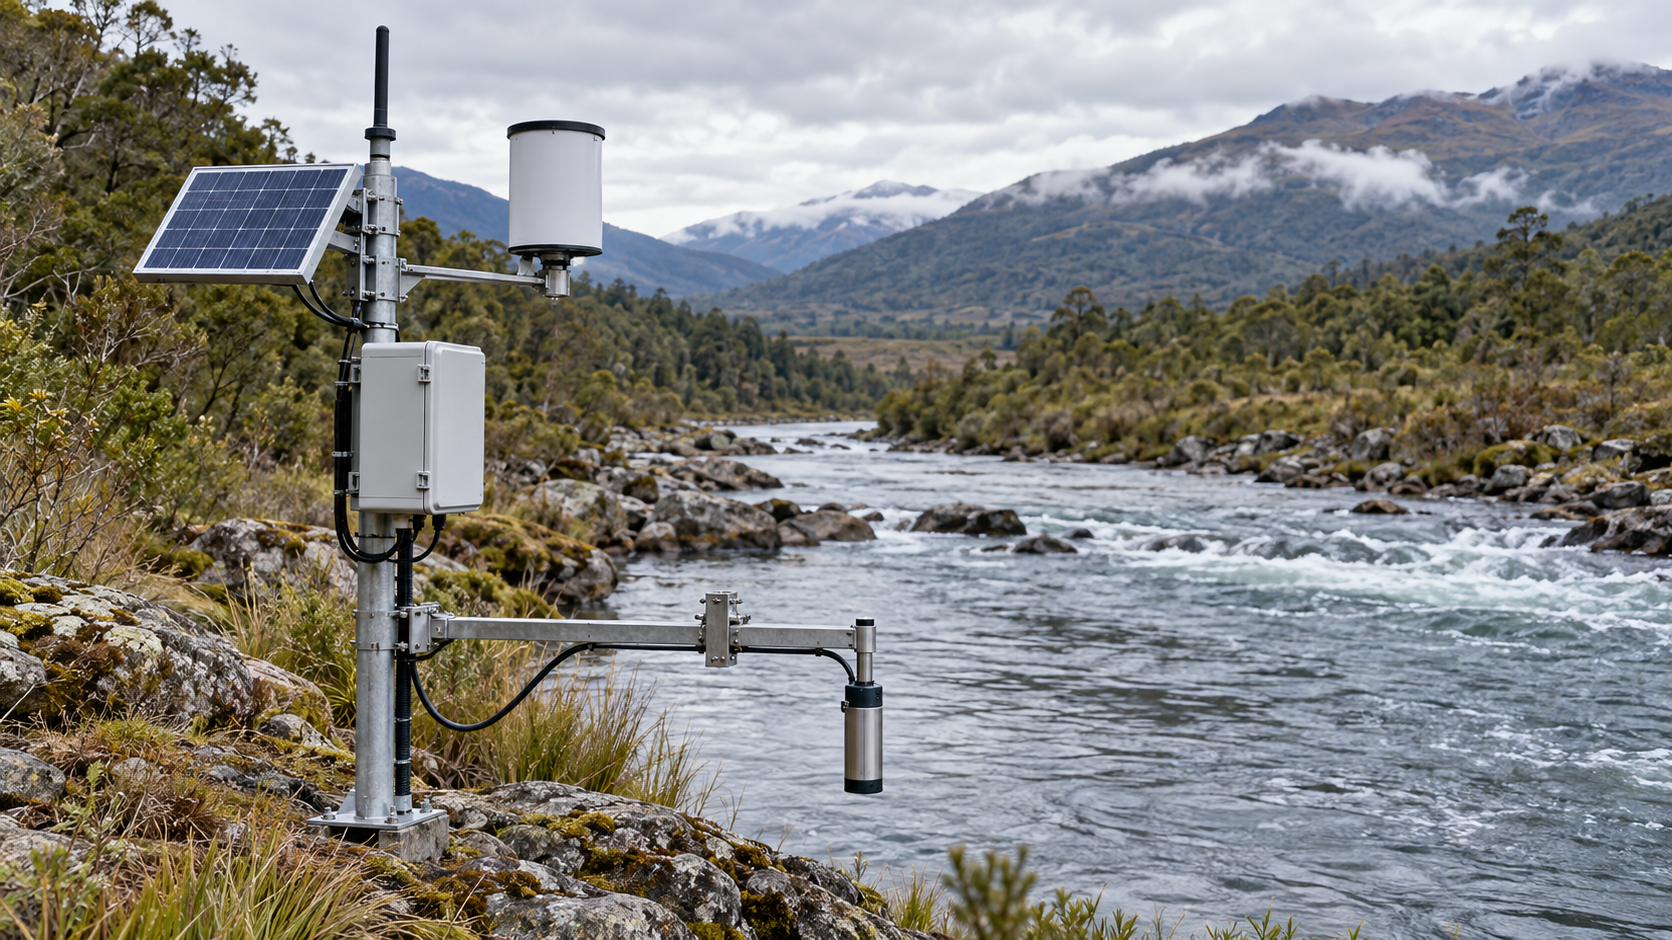 04 / BASIN MODULE↗
Sensor & data confidenceAVAILABLE · GET & POST ENDPOINT
Can we trust this river sensor reading before activating warning sirens?
Real-time screening for stale telemetry packets, ultrasonic bounce anomalies, rapid jump artifacts, and spatial rainfall radar blind spots before inputs reach sirens, downstream digital twins, or emergency dashboards.
Explore module ↗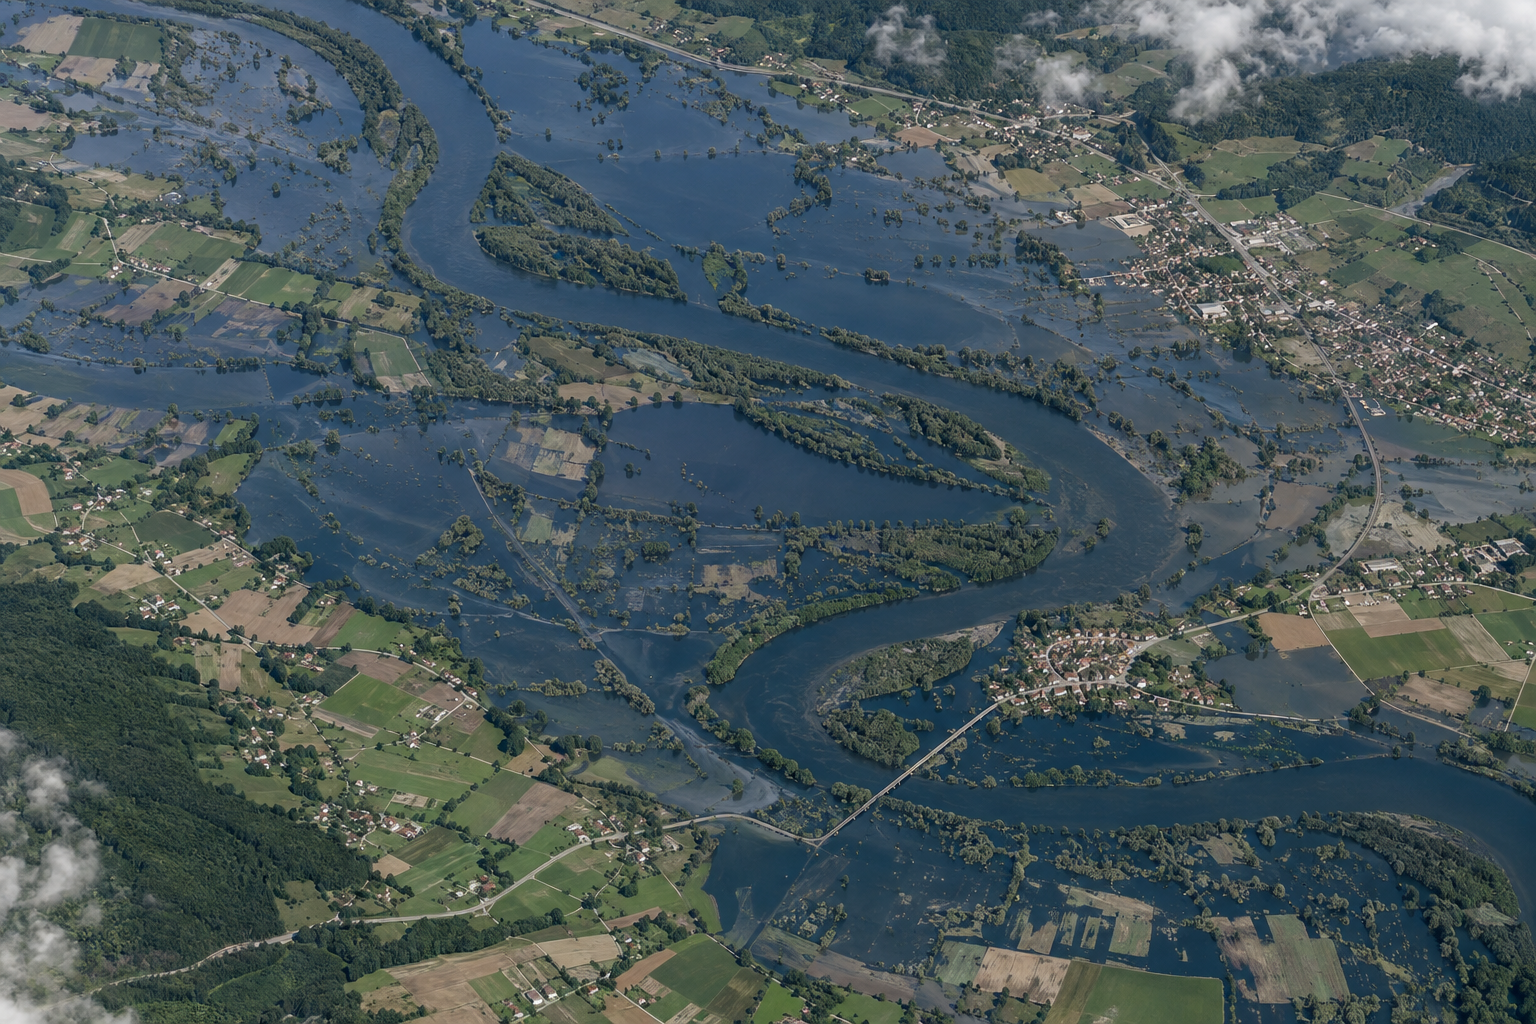 05 / BASIN MODULE↗
Post-flood extent mappingAVAILABLE · GET ENDPOINT
What was the actual extent of flood inundation—and which critical infrastructure was submerged?
Observed inundation footprint, water depth classification, and affected infrastructure candidate review derived from all-weather SAR and high-resolution optical satellite passes. Designed for incident review, damage reporting, and civil recovery.
Explore module ↗Module imagery is illustrative. Live precipitation, gauge values, and flood extents are served separately with source and timestamp context.
HOW THE SIGNAL BECOMES A DECISION
Follow the water from first rain to response.
Keep source time, catchment boundaries, sensor status, and confidence visible as information moves toward an operational decision.
01Observe the storm
Bring radar, satellite precipitation, forecast fields, and local gauges into a time-aligned view.
02Aggregate upstream
Summarise rolling rainfall for the tributaries above a gauge instead of averaging across a broad region.
03Relate rain to river response
Use historical rainfall and stage records to estimate response timing, while showing where calibration is weak.
04Review before action
Pass confidence, freshness, and data gaps with the API result; operators retain control of thresholds and alerts.
Operational boundary Regional precipitation and forecast grids describe atmospheric conditions; they do not replace calibrated river gauges, local flood warnings, or emergency authority.
ONE-CATCHMENT PILOT
Measure value on one calibrated river reach.
Start with one catchment and a small set of gauges. Compare upstream rainfall signals and forecast performance against historical events, then assess whether they add useful lead time for the local river thresholds. Results depend on data quality, event coverage, and site calibration; no warning gain is assumed in advance.
WHAT THE TRIAL MEASURESSET WITH LOCAL OPERATORS
Lead timeRain → river rise
Event detectionObserved storms
False alertsThreshold misses
Data healthGauge uptime
Minimum inputs: catchment and gauge locations, historical rainfall and river-stage records, rating curves, and locally agreed alert thresholds. Evaluate lead time, event detection, false alerts, and telemetry completeness.
CLEAR ABOUT THE DATA
Meteorological inputs guide anticipation.
River calibration governs action.
Precipitation radar and numerical weather grids provide crucial upstream spatial visibility that point rain gauges cannot offer. They reveal approaching storm intensity and tributary concentration hours before downstream gauges react.
However, hydraulic stage-discharge curves, localized bridge backwater, debris damming, and weir operations require in-situ gauge calibration. Module 3 explicitly presents uncertainty envelopes and requires historical sensor records for full calibration.
Read the Hydrological API documentation ↗