Isolate tributary contributions
Identify which upstream sub-basin is receiving the heaviest rainfall before downpours reach confluence sensors.
 COMMERCIAL PRODUCT
CATCHMENT HYDROLOGY & RAINFALL API
Observed and forecast rainfall totals for the area upstream of each river sensor, broken down by tributary sub-catchment across rolling 3, 6, 12, 24 and 48-hour accumulation windows. Blends Tomorrow.io precipitation radar with numerical weather grids.
THE DECISION IT SUPPORTS
By delineating hydrological sub-basins above each river monitoring station, AtmosGrid computes rolling rainfall accumulations per tributary. Operations teams know which fork or ridge is receiving heavy downpours hours before the water reaches downstream sensors.
WHY TEAMS USE IT
Each result is designed to narrow a decision, show the inputs behind it, and surface what must still be checked locally.
Identify which upstream sub-basin is receiving the heaviest rainfall before downpours reach confluence sensors.
Monitor 3h, 6h, 12h, and 24h windows to evaluate flash flood risks and sustained catchment saturation.
Replace point rain gauges with continuous spatial catchment coverage across steep headwaters.
Blend live precipitation radar with 48h forecasts for seamless operational foresight.
FROM REGION TO FIELD
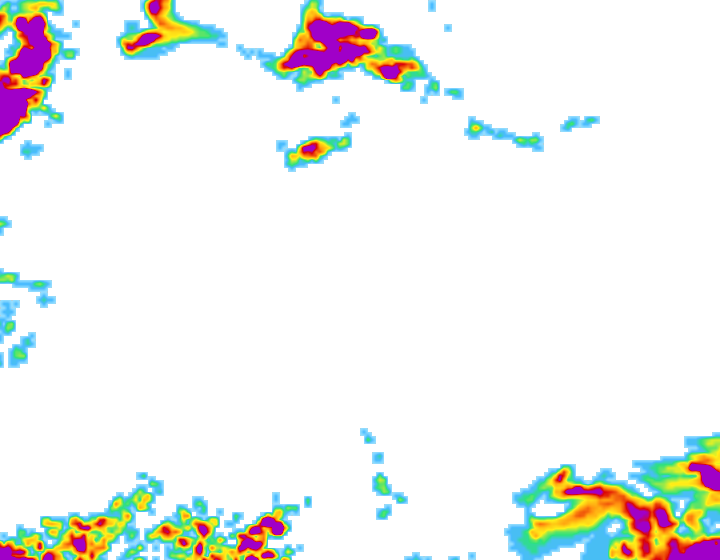
Images illustrate the operational setting. They are not live observations; use source timestamps and local measurements for decisions.
PRECIPITATION BLENDBlends sub-hourly precipitation radar with numerical weather predictions across topographical contours.
 TRIBUTARY ACCUMULATION
Isolates which upstream sub-catchment is receiving the highest rainfall volume before it reaches sensors.
 RUNOFF SCREENING
Classifies whether rain intensity is accelerating, steady, or waning across tributary watersheds.
THE INFORMATION STACK
Availability is stated per input. AtmosGrid never converts a missing parcel observation into a made-up field value.
A PRACTICAL WORKFLOW
The workflow keeps model context, field evidence and human approval in their proper places.
Map the drainage network and tributaries upstream of each operational river gauging station.
Blend sub-hourly radar reflectivities, satellite IR, and numerical forecast grids into a continuous surface.
Compute area-weighted observed (3h, 6h, 12h, 24h) and forecast (3h, 6h, 12h, 24h, 48h) rainfall totals.
Deliver JSON responses directly to flood warning dashboards, sirens, and hydrological digital twins.
HOW INFORMATION BECOMES USEFUL
These are screening patterns, not automatic instructions. Operational thresholds and local advisories remain authoritative.
FOR PRODUCT TEAMS
The response exposes gaps and limitations so an application can explain confidence instead of hiding it.
/api/v1/hydrology/basin/catchment-rainfall{
"catchment_id": "basin-wye-severn-upper",
"sensor_ids": ["gauge-us-01", "gauge-nf-02", "gauge-sb-04"],
"sub_tributaries": ["trib-gorge-head", "trib-north-fork", "trib-south-branch"]
}decision response{
"catchment_id": "basin-wye-severn-upper",
"total_catchment_area_km2": 482.6,
"basin_weighted_totals_mm": {
"observed": {
"rolling_3h": 17.6,
"rolling_6h": 32.8,
"rolling_12h": 50.4,
"rolling_24h": 65.2
},
"forecast": {
"next_3h": 14.1,
"next_6h": 25.4,
"next_24h": 44.8,
"next_48h": 56.0
}
},
"upstream_alert_status": "high_runoff_risk",
"tributary_breakdown": [
{
"tributary_id": "trib-south-branch",
"name": "South Branch Ridge",
"area_km2": 112.3,
"observed_accumulation_mm": { "rolling_3h": 22.8, "rolling_6h": 41.0, "rolling_24h": 79.2 },
"forecast_accumulation_mm": { "next_3h": 19.5, "next_6h": 33.2, "next_24h": 53.8 },
"intensity_mm_h": 7.6,
"trend": "accelerating",
"dominant_source": "blended_radar_satellite"
}
]
}CAPABILITY BOUNDARIES
BUILD RESPONSIBLY
Pair AtmosGrid’s regional weather context with local measurements, crop stage, variety guidance and qualified agricultural advice.