What weather conditions could affect the operation next?
Bring satellite observations and forecast fields into one operational view of airport conditions, en-route weather, and changing regional patterns.
Explore aviation use cases ↗ COMMERCIAL PRODUCT
See changing conditions across land, sea, and sky.AtmosGrid is a commercial weather intelligence product, bringing satellite observations and forecasts into one clear, map-ready view for operational teams.
Built forAviation · Energy · Agriculture
Marine & ports · Cities & infrastructure · Storm monitoring
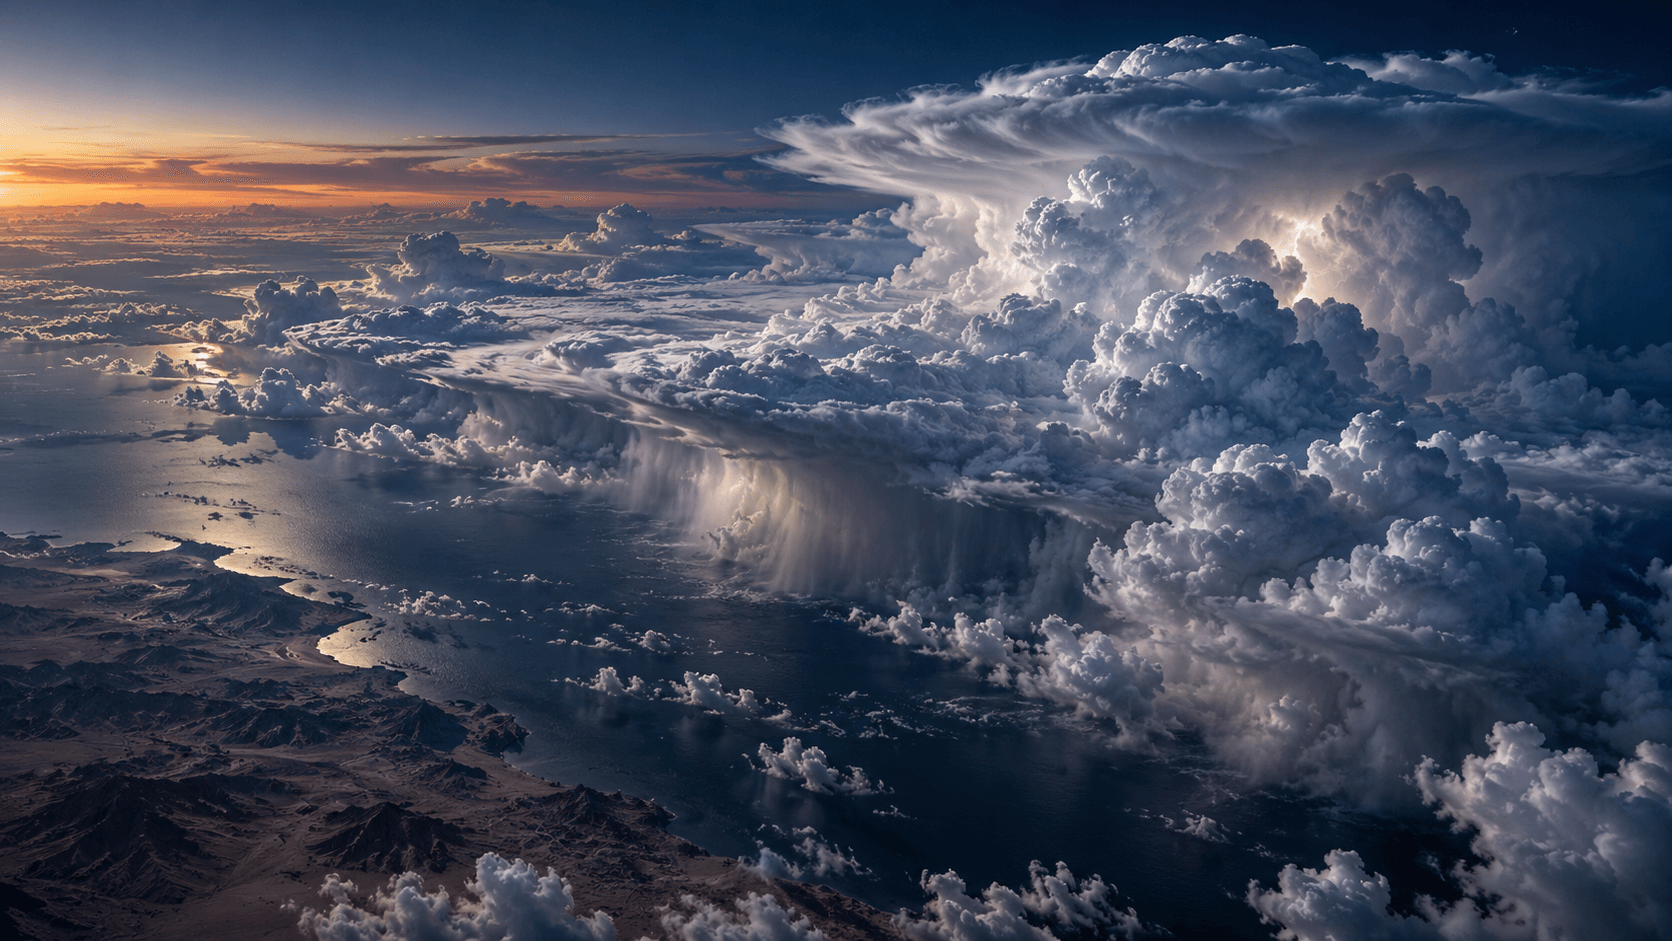
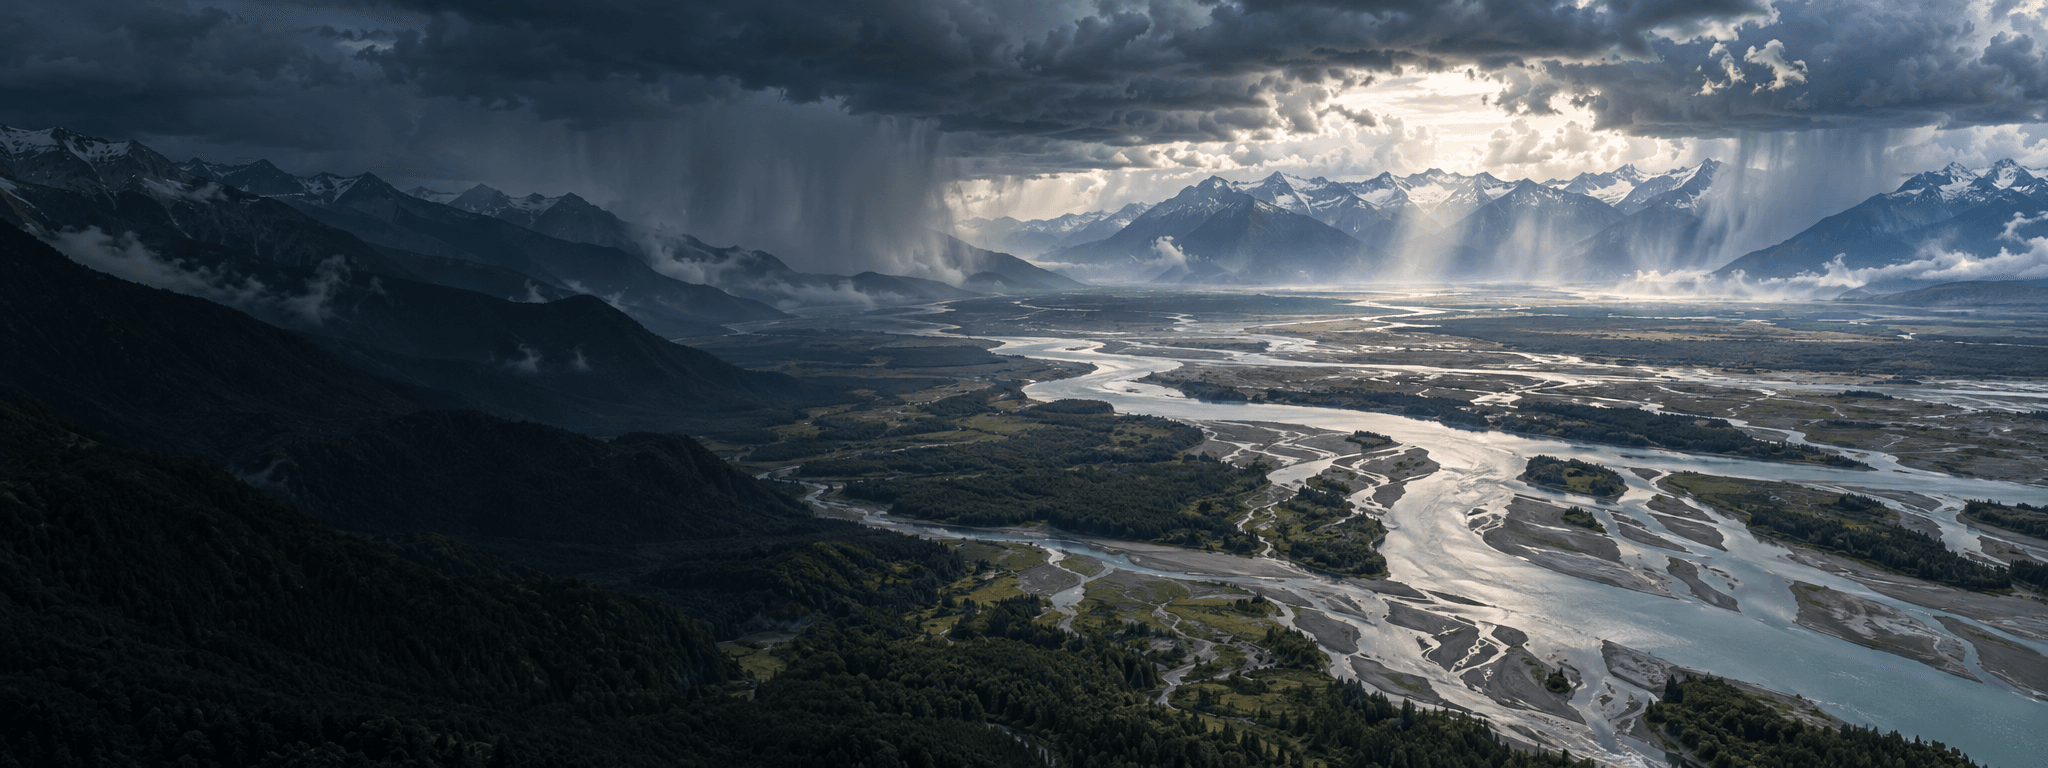
THE LAYER COLLECTION
A weather map becomes useful when you know what to look for. Explore the physical conditions behind a forecast, then combine layers to understand what they mean for your location.
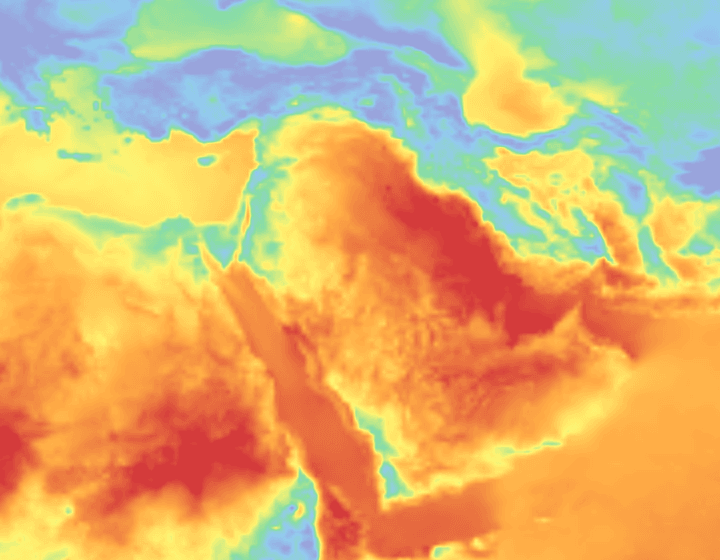
Compare near-surface air temperature across a region. Pair it with humidity and wind to assess outdoor working conditions and changes in cooling demand.
Explore temperature layers ↗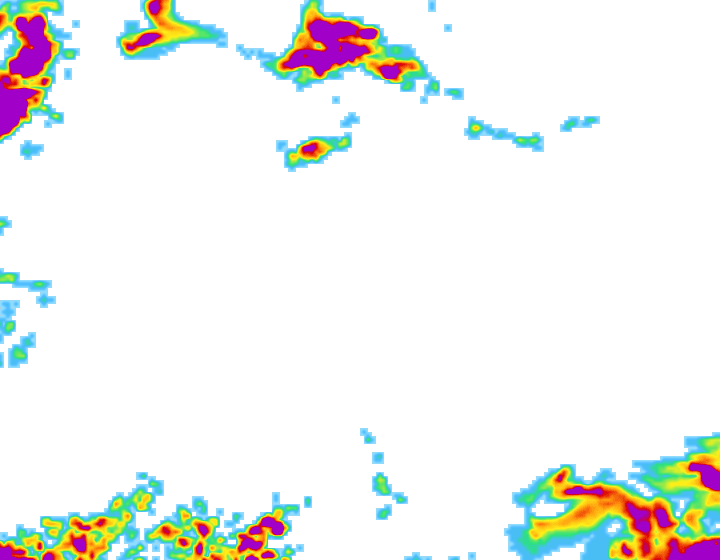
Identify areas of forecast precipitation. Compare forecast rainfall with available IMERG observations to support field scheduling, drainage monitoring, and event review.
Explore precipitation layers ↗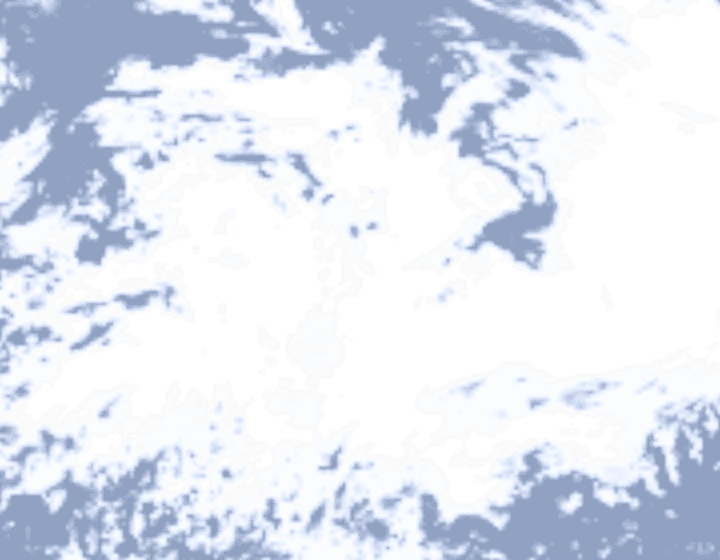
Understand cloud extent. Combine cloud, visibility, and radiation layers to add context to airport conditions and solar-generation planning.
Explore cloud cover layers ↗
Inspect incoming shortwave radiation alongside cloud cover and temperature. Use these inputs in your own solar-output and energy-demand models.
Explore solar radiation layers ↗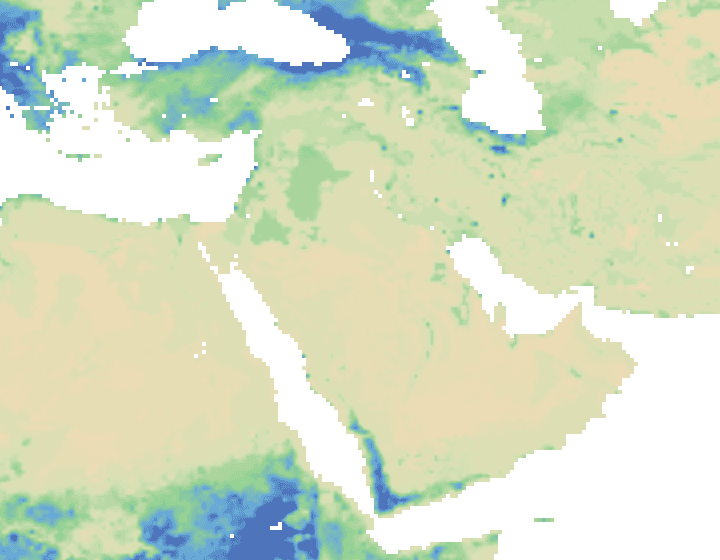
Compare modelled soil moisture between areas and depths. Combine it with rain and evaporation to support irrigation reviews and dry-condition monitoring.
Explore soil moisture layers ↗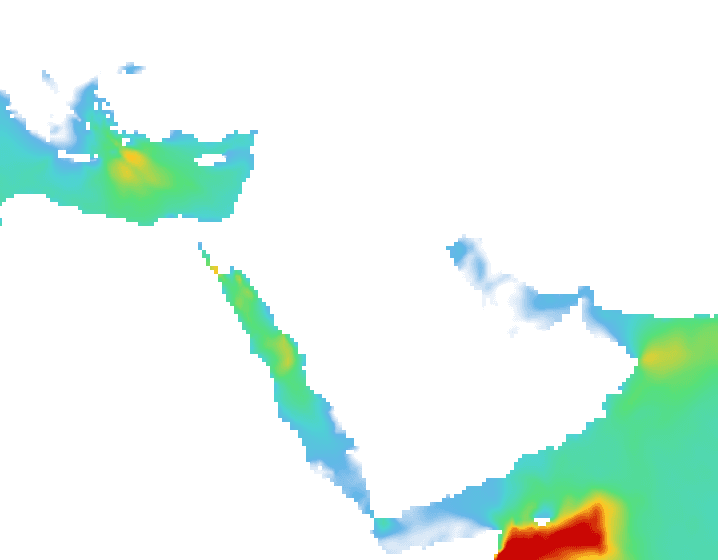
Explore significant wave height with wave period and direction. Bring sea-state context into port planning, offshore maintenance, and coastal operations.
Explore wave height layers ↗Processed regional raster samples shown without a basemap. These saved frames are illustrative, not current conditions. Open a regional viewer for available layers, timestamps, units, and legends.
BUILT AROUND YOUR QUESTIONS
Start with the question your team needs to answer. Combine environmental layers for context in your own workflows and operational thresholds.
Bring satellite observations and forecast fields into one operational view of airport conditions, en-route weather, and changing regional patterns.
Explore aviation use cases ↗Combine rainfall, heat, soil moisture, and wind to build field-monitoring tools for farms, irrigation teams, and agricultural services.
Explore agriculture use cases ↗Connect cloud, radiation, wind, temperature, and marine conditions to renewable-generation monitoring and energy operations products.
Explore energy use cases ↗Bring heat, rainfall, wind, and humidity into city, utility, transport, and infrastructure dashboards with consistent regional coverage.
Explore cities & infrastructure use cases ↗Bring wave, wind, precipitation, and satellite context into port operations, offshore planning, and coastal monitoring applications.
Explore marine & ports use cases ↗Combine geostationary imagery, lightning observations, precipitation estimates, and forecasts for a richer view of developing weather systems.
Explore storm monitoring use cases ↗FROM EXPLORATION TO INTEGRATION
Open Ukraine, Eastern Europe, Wider Europe, Americas, India, or Middle East. Available layers reflect each region’s satellite downlinks and numerical models.
Check its timestamp, units, colour legend, and coverage. Adjust opacity to keep geographic context visible.
Use the documented APIs and map endpoints to bring the same information into your own interface.
KNOW WHAT YOU ARE LOOKING AT
Satellite products describe remotely sensed conditions at an observation time. Forecast layers describe modelled conditions at a valid time. Compare timestamps before drawing conclusions.
A product in a catalogue is not necessarily a processed map layer. The regional viewer shows the layers currently available from the backend.
Units, value ranges, resolution, and missing pixels matter. Check the layer metadata before interpreting a map.
Use weather layers alongside local observations and your own decision criteria. A layer alone is not an official warning or a site-specific safety decision.
BUILT FOR REAL-WORLD DECISIONS
Inspect conditions on a map, query a location through the API, or connect AtmosGrid to your own application.
THE PRODUCT COLLECTION
Focused workspaces turn regional weather signals into practical context for teams working on land, energy assets, and waterways.
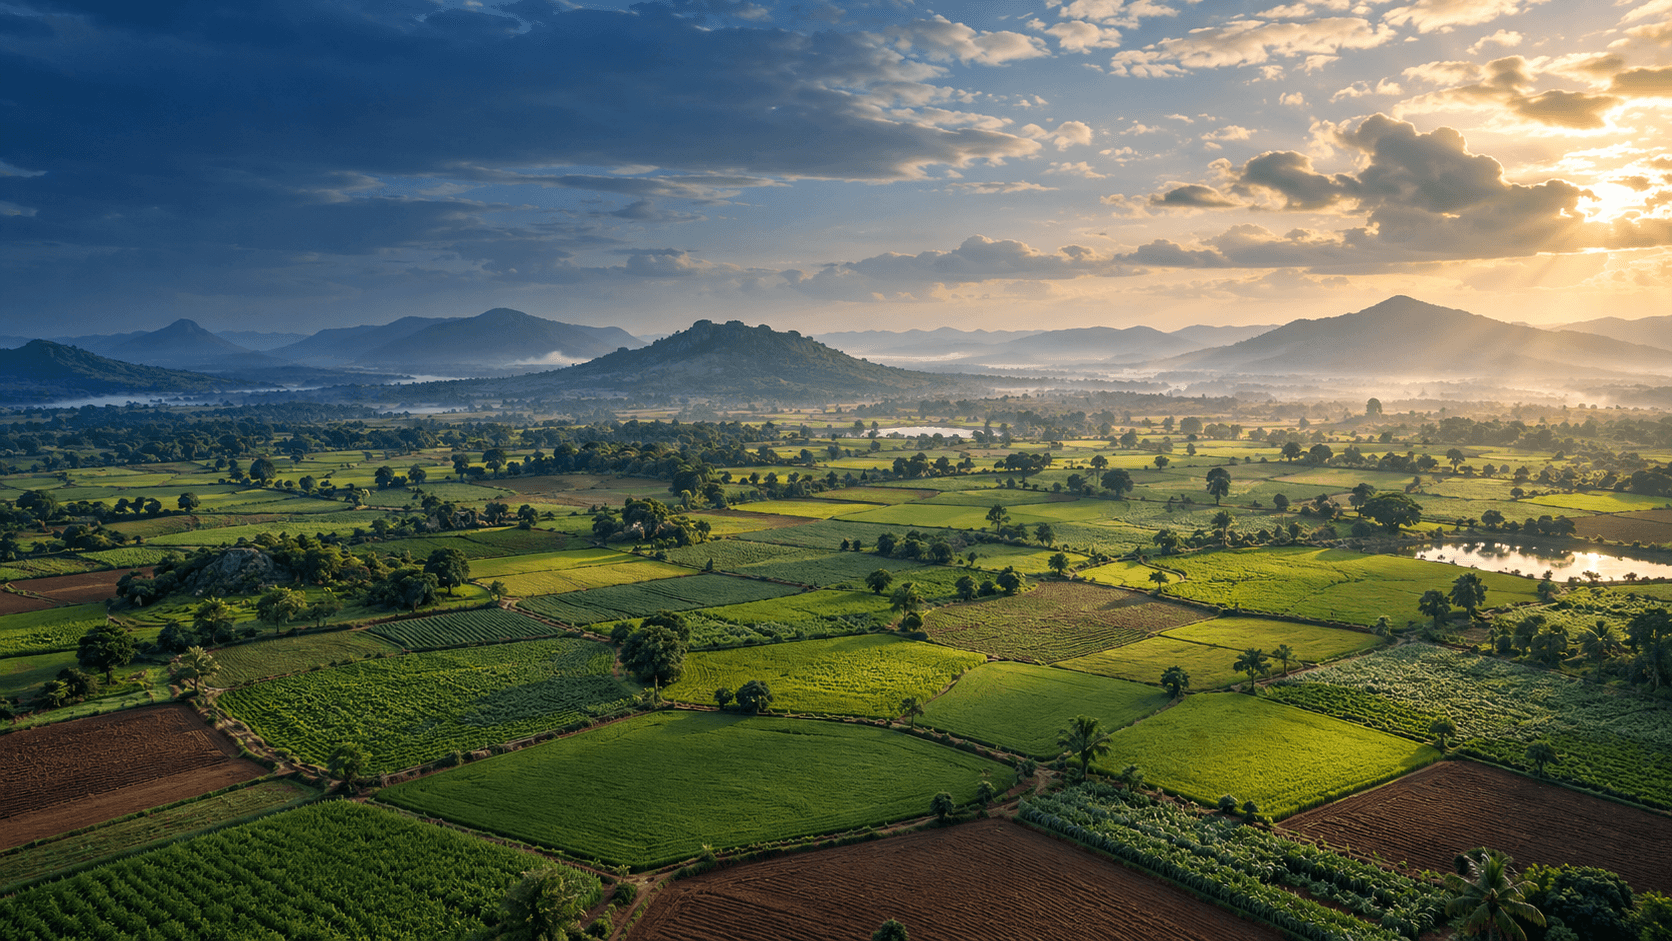
AGRICULTURE
Bring weather context into season planning, risk reviews, damage assessment, and harvest coordination.
EXPLORE THE CAPABILITIES
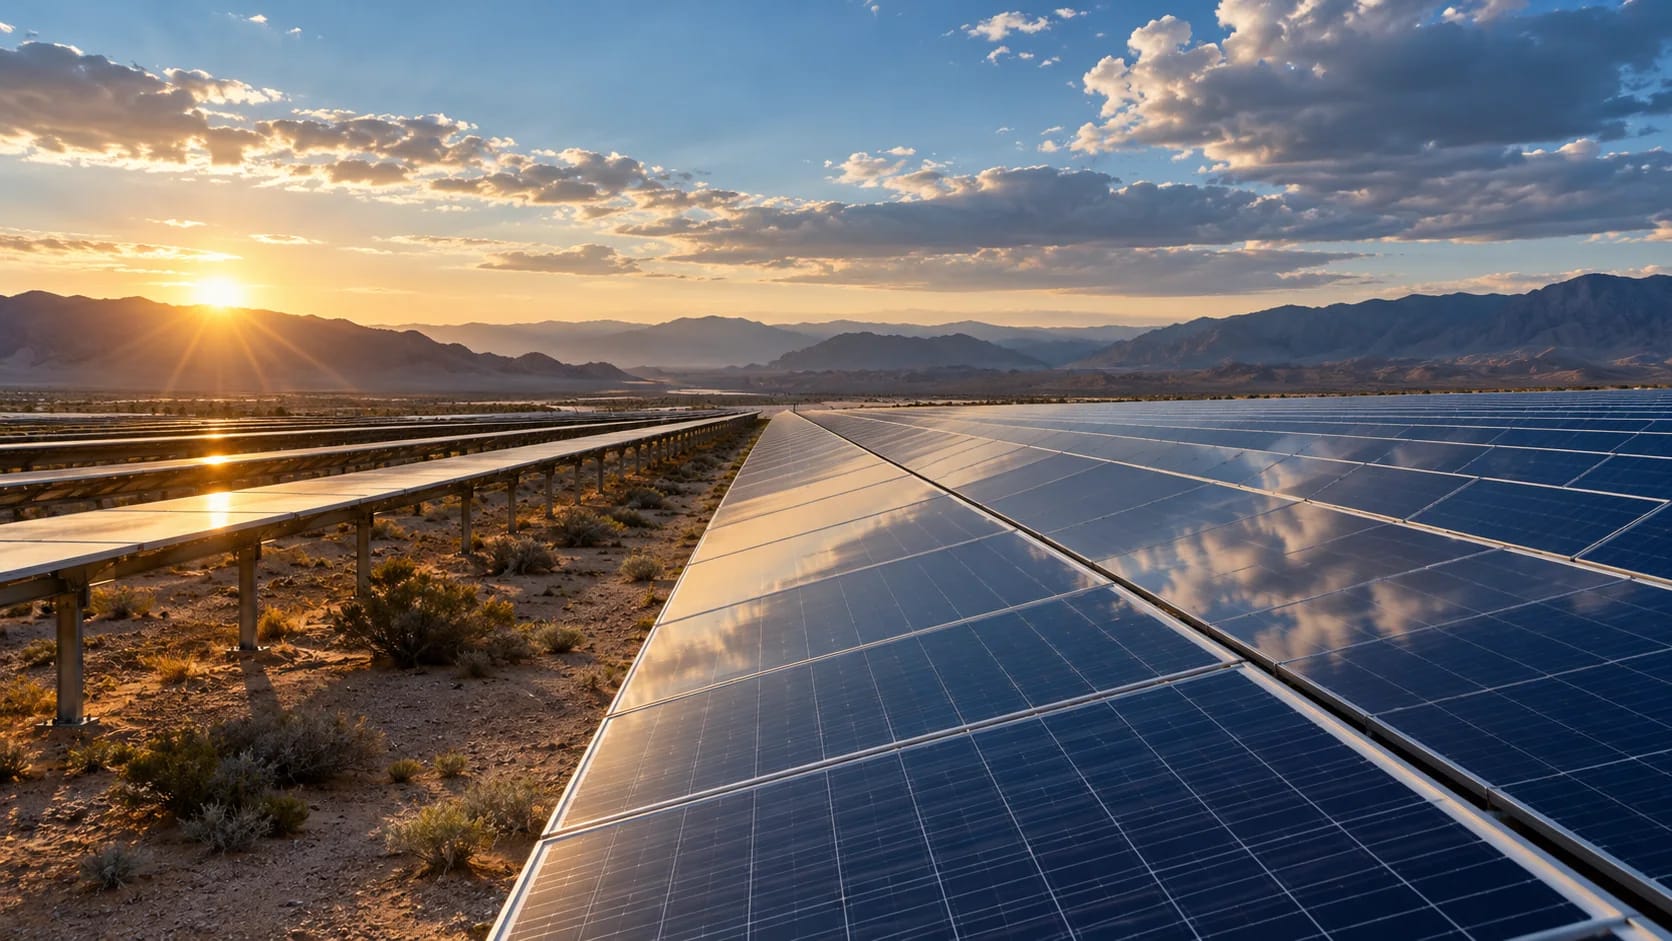
SOLAR & ENERGY
Investigate how cloud, dust, air quality, and environmental change affect solar operations and forecasts.
EXPLORE THE CAPABILITIES
HYDROLOGY
Connect upstream rainfall, forecast performance, river response, and sensor confidence in one catchment workflow.
EXPLORE THE CAPABILITIES
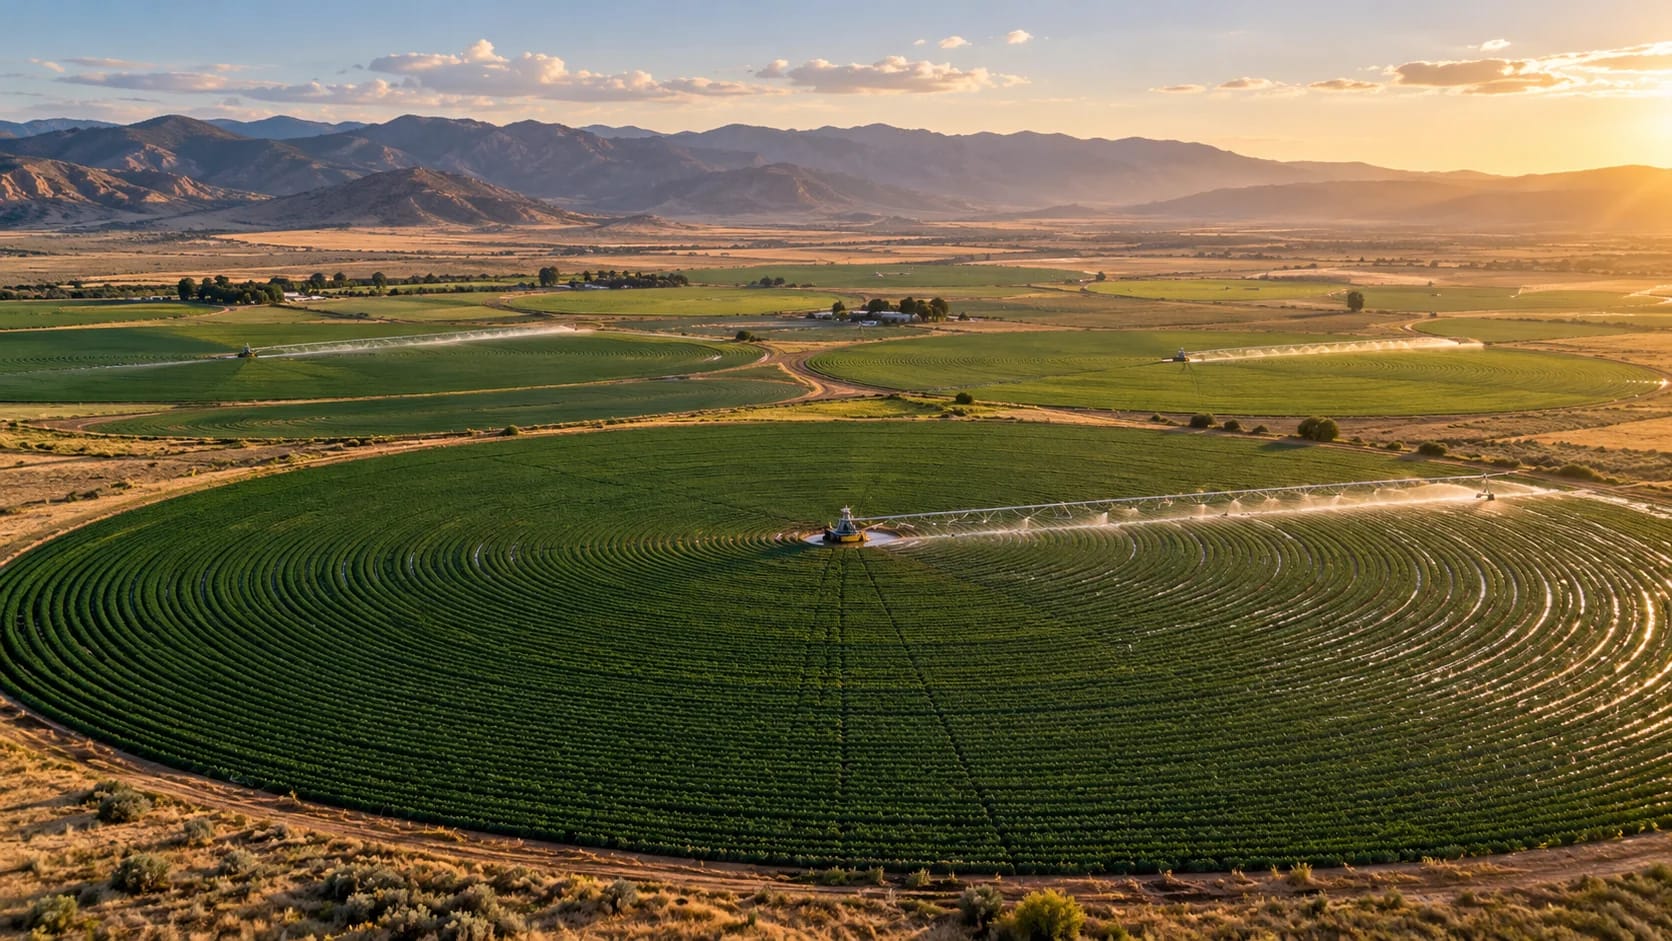
PRECISION WATER
Compare irrigation demand with applied water and show where sensor coverage needs attention.
EXPLORE THE CAPABILITIES
GLOBAL COVERAGE, REGIONAL DETAIL