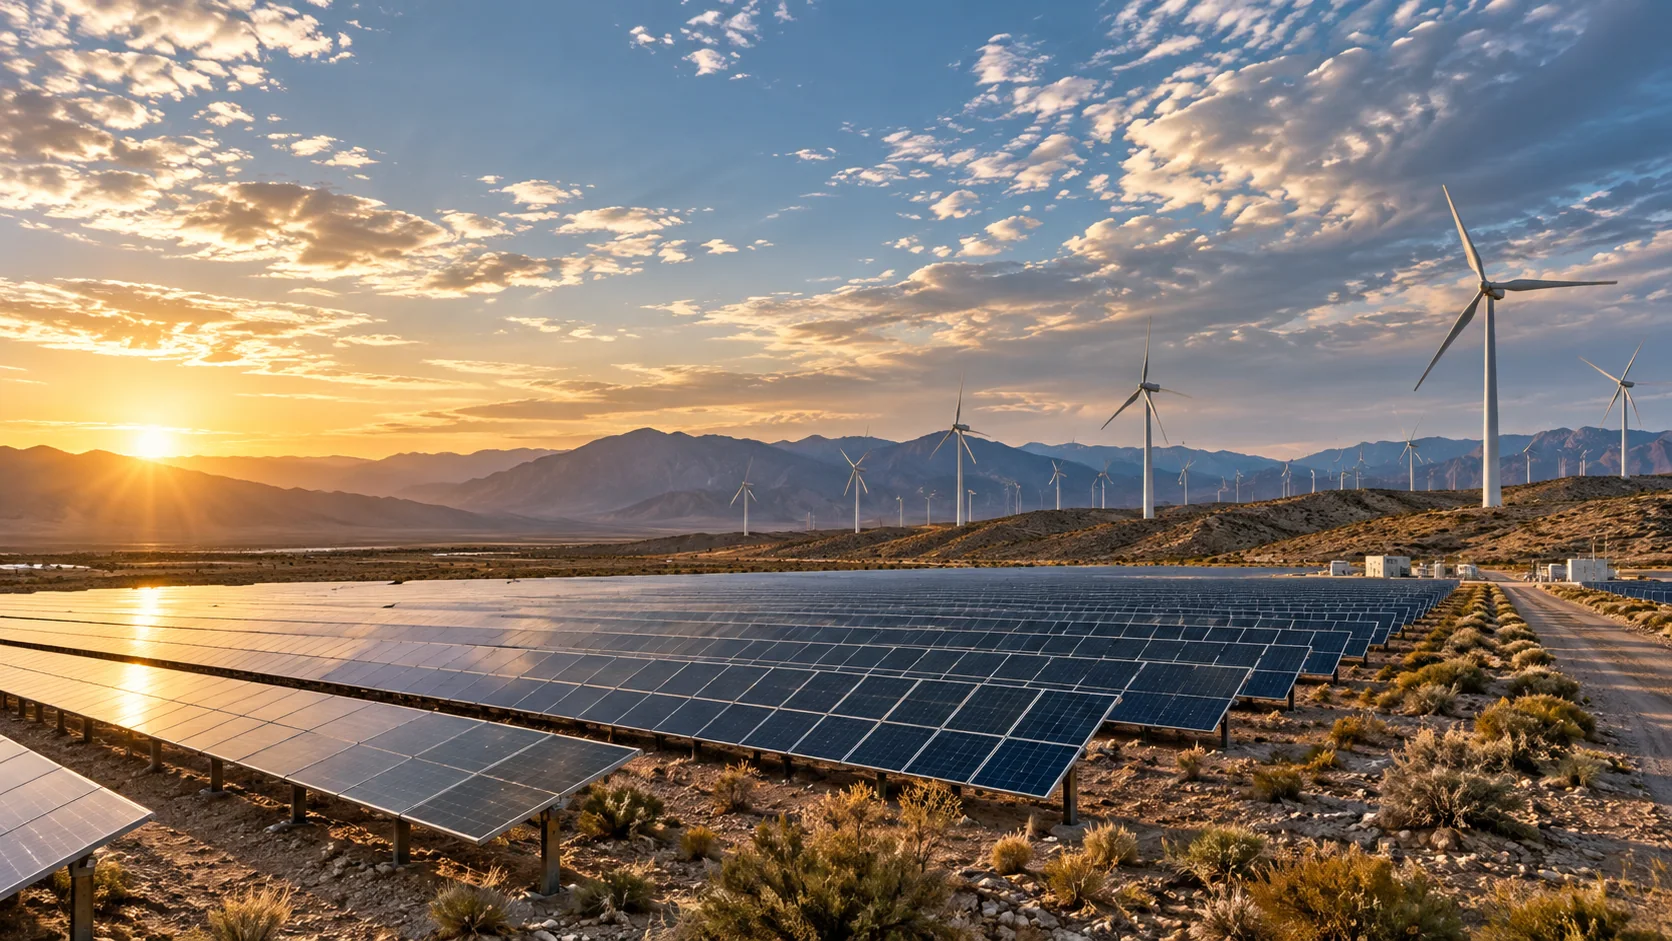
SOLAR ENERGY / DECISION WORKSPACE
Make the next energy decision with atmosphere in view.
Four diagnostic tools for solar operators, air quality teams and environmental analysts — grounded in satellite observations, GFS fields and honest data limits.
FROM ORBIT TO OPERATIONS
Four signals.
One clearer picture.
Start with the diagnostic your team needs. Each module explains the question it answers, the inputs it requires and what still needs local validation — so solar operators and analysts know what to do next.
01Attribute forecast errors to atmosphere
→ 02Monitor dust and cloud in real time
→ 03Flag low-confidence air quality cells
→ 04Track land-cover and dust-source change
THE SOLAR TOOLKIT
Choose the diagnostic
you need to run.
Open a module for its workflow, example scenarios, required inputs, API request and capability boundaries.
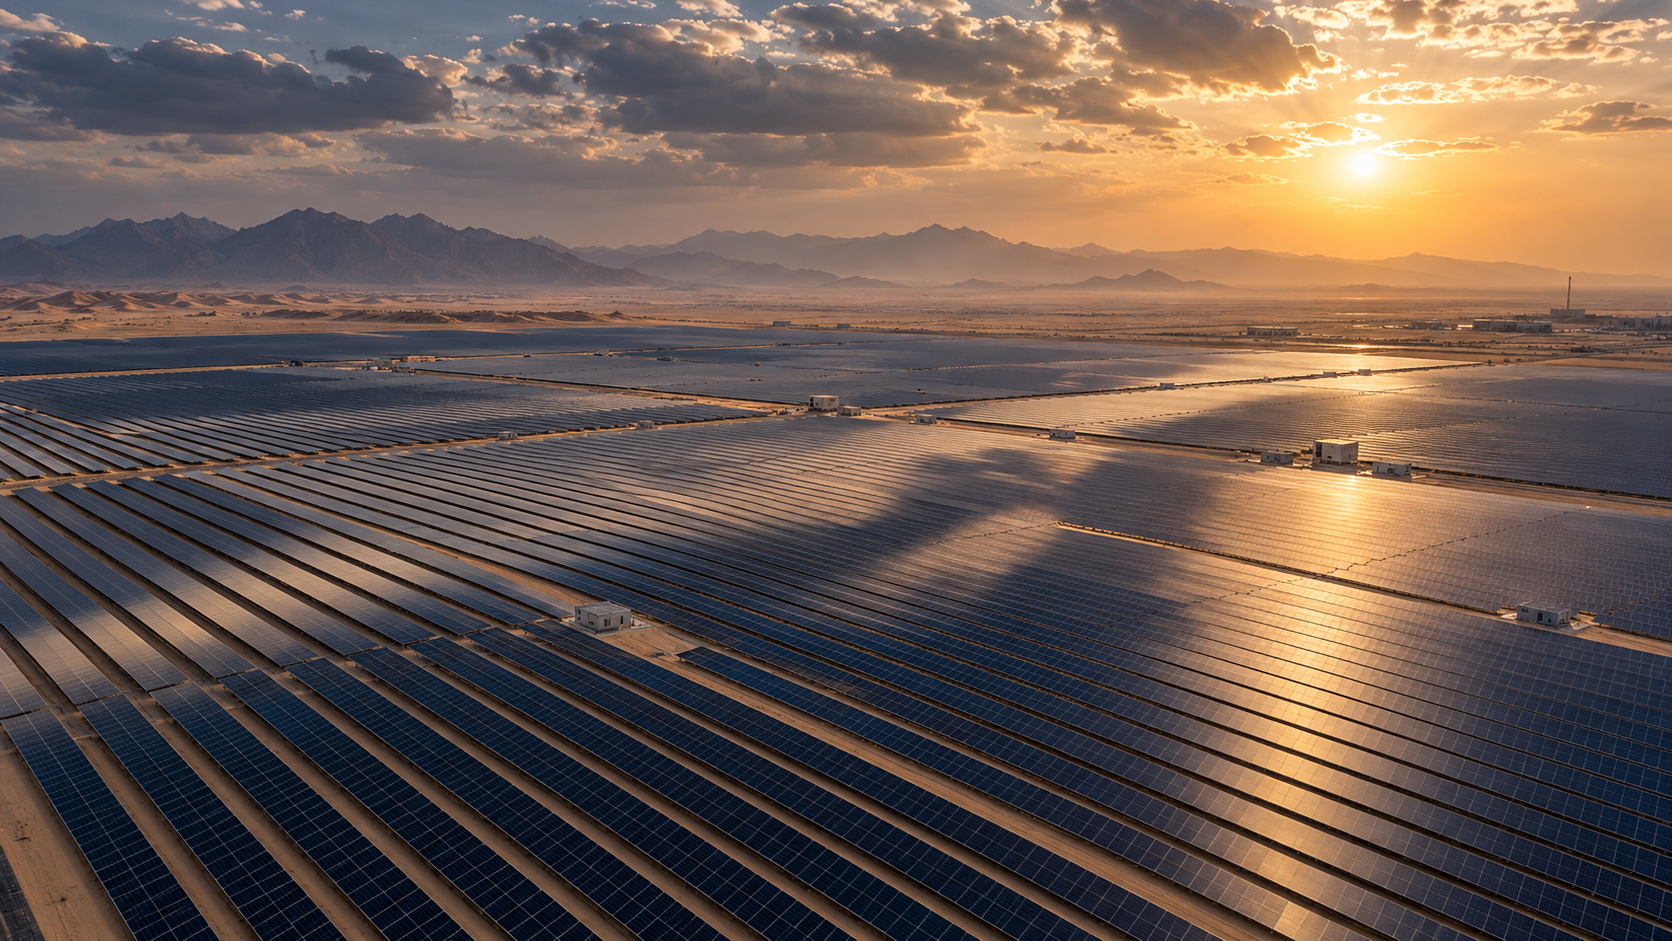 01 / SOLAR PRODUCT↗
Solar forecast error attributionAVAILABLE · POST ENDPOINT
Why did this hour's generation differ from the forecast?
Compare observed versus forecast generation for each hour. Isolate the contribution of cloud cover, aerosol optical depth, dust risk and panel temperature to the error. Improve future forecasts with transparent, machine-readable attribution.
Explore product ↗ 02 / SOLAR PRODUCT↗
Dust & cloud observation feedAVAILABLE · GET ENDPOINT
What did the atmosphere look like above the plant in the past 24 hours?
A maintained regional feed of cloud cover, aerosol optical depth, shortwave radiation and estimated PV generation potential. Gives solar operators a consistent satellite-derived input feed to cross-check internal forecasts and diagnose persistent biases.
Explore product ↗ 03 / SOLAR PRODUCT↗
Air quality data confidenceAVAILABLE · GET ENDPOINT
Which cells in the air quality map can we publish confidently — and which need a caution flag?
A grid of observation age, satellite coverage fraction, nearby ground-station count and uncertainty flags for each map cell. Helps air quality teams distinguish well-supported estimates from sparse-observation zones before publishing public air quality maps.
Explore product ↗ 04 / SOLAR PRODUCT↗
UAE environmental change feedAVAILABLE · GET ENDPOINT
Which areas in the UAE have changed — and what kind of change is it?
Timestamped imagery pairs, spectral change scores, cover-class transitions and review status for UAE cells. Supports solar-site monitoring, dust source tracking and urban-growth analysis without manufacturing conclusions from uncertain signals.
Explore product ↗CLEAR ABOUT THE DATA
Satellite signals guide attention.
Plant measurements guide action.
Satellite and forecast products describe atmospheric conditions at their own resolution and update cadence. They can help operators spot patterns, correlate errors and schedule maintenance.
Panel soiling, tracker faults, inverter curtailment, and ground irradiance calibration are not inferred when they are missing. Review each module's data gaps before using a result operationally.
Read the API documentation ↗