Monitor regional dust events
Receive a dust risk score every three hours, derived from GFS visibility, wind and relative humidity.
 COMMERCIAL PRODUCT
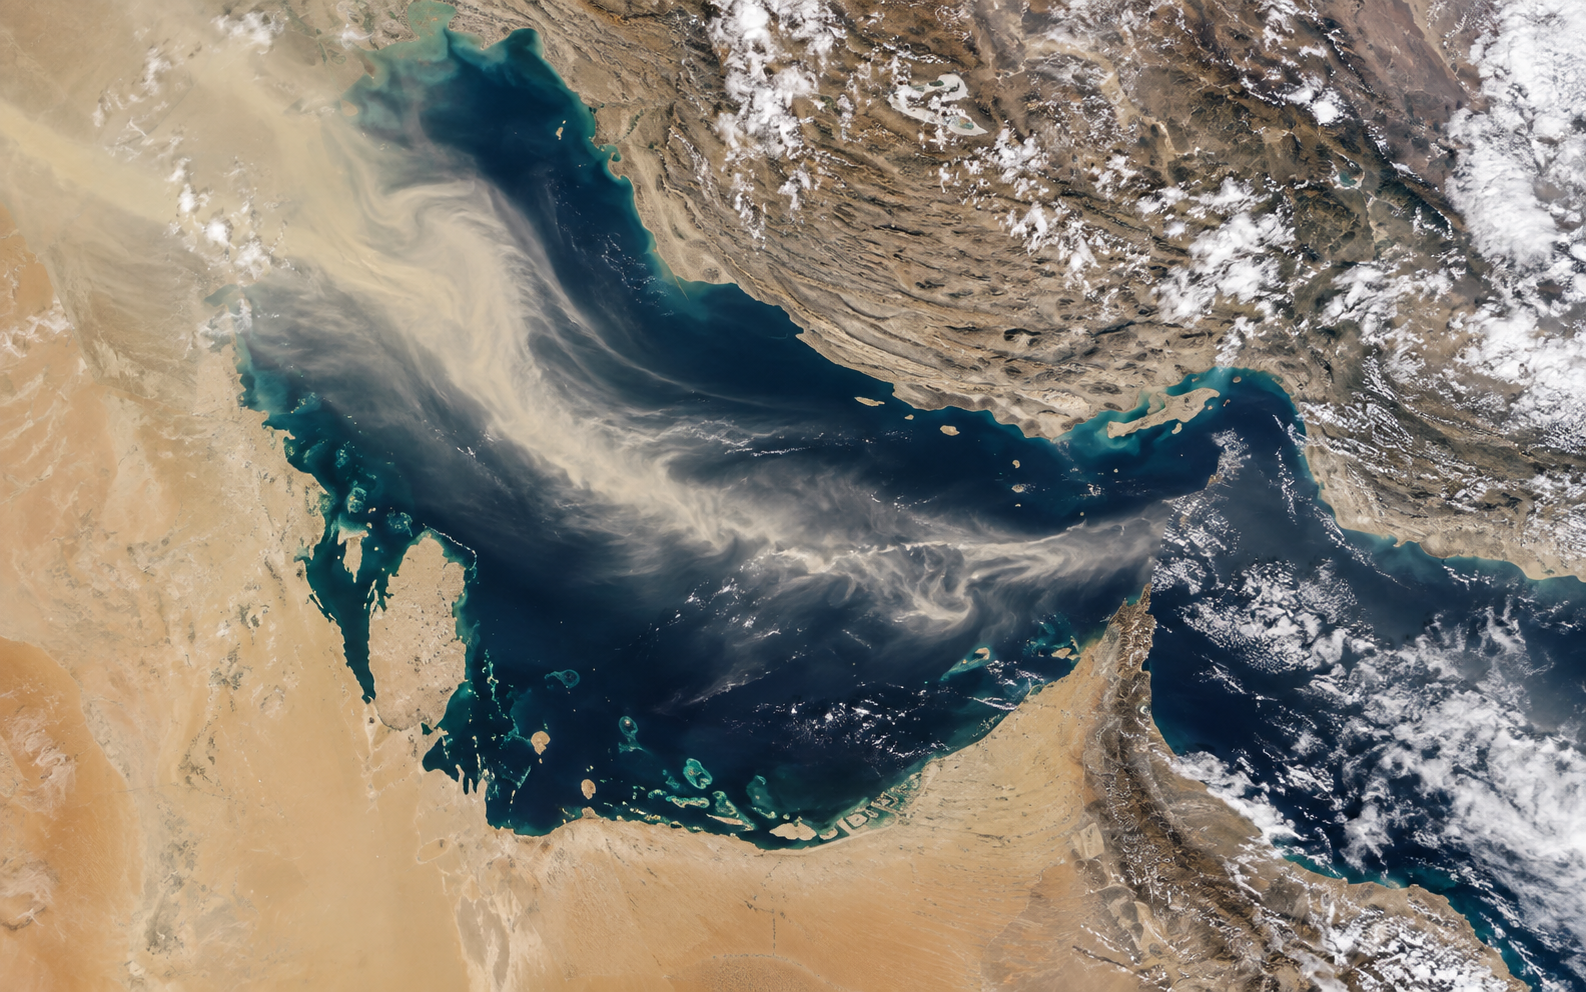
SOLAR INPUT OBSERVATION FEED
A maintained regional feed of cloud cover, aerosol optical depth, shortwave radiation and estimated PV generation potential. Gives solar operators a consistent satellite-derived input feed to cross-check internal forecasts and diagnose persistent biases.
THE DECISION IT SUPPORTS
The feed returns a site-level time series of GFS-derived and satellite-informed atmospheric inputs. Each record carries a confidence flag. Live Meteosat-9 and CAMS aerosol feeds are catalogued and will replace heuristic estimates when operator credentials are provided.
WHY TEAMS USE IT
Each result is designed to narrow a decision, show the inputs behind it, and surface what must still be checked locally.
Receive a dust risk score every three hours, derived from GFS visibility, wind and relative humidity.
Compare GFS shortwave radiation against operational plant models to identify persistent regional biases.
Store hourly atmospheric signals alongside plant generation logs for retrospective attribution.
Use sustained elevated AOD or dust_risk_score to trigger conditional panel-cleaning dispatch.
FROM REGION TO SITE
Images illustrate the operational setting. They are not live observations; use source timestamps and local measurements for decisions.
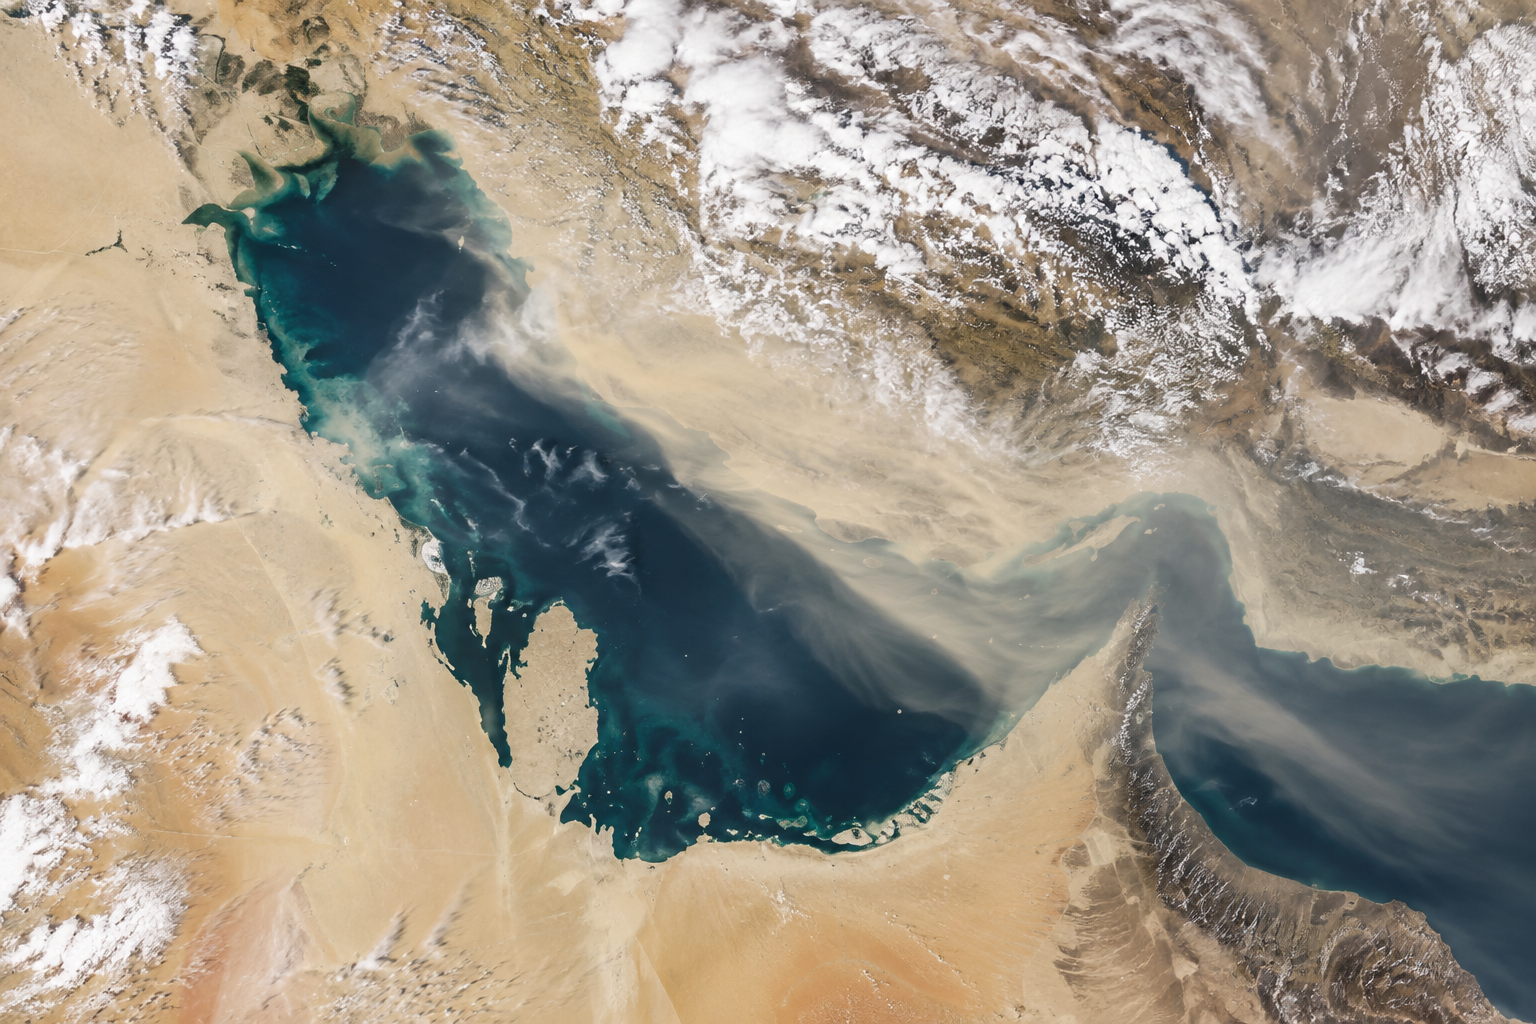 SATELLITE LAYER
Meteosat-9 dust_rgb and GFS shortwave provide the regional picture.
 SITE TIME SERIES
Time-series feed links forecast irradiance to aerosol measurements.
 SOLAR RADIATION
GFS DSWRF feeds an estimated generation figure per kWp installed.
THE INFORMATION STACK
Availability is stated for every input. Missing site telemetry, irradiance readings, or atmospheric observations are identified rather than inferred.
A PRACTICAL WORKFLOW
The workflow keeps model context, field evidence and human approval in their proper places.
Latitude and longitude snap to the nearest GFS grid node.
Cloud cover, AOD proxy, shortwave radiation and dust risk are returned per hour.
Place AtmosGrid values alongside internal plant model output.
Consistent gaps suggest a regional bias correction is needed.
Use the time series as ground-truth inputs for error attribution analysis.
HOW INFORMATION BECOMES USEFUL
These are screening patterns, not automatic instructions. Operational thresholds and local advisories remain authoritative.
FOR PRODUCT TEAMS
The response exposes gaps and limitations so an application can explain confidence instead of hiding it.
/api/v1/energy/middle-east/solar-feedGET /api/v1/energy/middle-east/solar-feed
?latitude=24.29
&longitude=54.61
&hours_back=24decision response{
"latitude": 24.29,
"longitude": 54.61,
"hours_returned": 24,
"time_series": [{
"utc_time": "2026-10-02T08:00:00Z",
"shortwave_radiation_w_m2": 812.4,
"cloud_cover_percent": 14.2,
"aerosol_optical_depth": 0.24,
"dust_risk_score": 38.1,
"estimated_pv_kwh_per_kwp": 0.65,
"confidence": "medium"
}]
}CAPABILITY BOUNDARIES
BUILD RESPONSIBLY
Pair AtmosGrid’s regional weather context with local irradiance sensors, site telemetry and operator review.