Flag cells before publishing
Each cell carries an overall_confidence level — high, medium or low — that can drive automatic display logic.
 COMMERCIAL PRODUCT

AIR QUALITY DATA CONFIDENCE
A grid of observation age, satellite coverage fraction, nearby ground-station count and uncertainty flags for each map cell. Helps air quality teams distinguish well-supported estimates from sparse-observation zones before publishing public air quality maps.
THE DECISION IT SUPPORTS
The confidence grid returns a machine-readable table of quality indicators per cell. Monitoring platforms can use these flags to automatically suppress or caveat low-confidence cells, protecting map users from acting on poorly supported estimates.
WHY TEAMS USE IT
Each result is designed to narrow a decision, show the inputs behind it, and surface what must still be checked locally.
Each cell carries an overall_confidence level — high, medium or low — that can drive automatic display logic.
Time-since-last-observation distinguishes real-time data from hours-old backfill.
Cloud obscuration and orbit gaps affect satellite-derived estimates in predictable ways.
Cells with no nearby stations cannot be validated and are marked explicitly.
FROM REGION TO SITE
Images illustrate the operational setting. They are not live observations; use source timestamps and local measurements for decisions.
 OBSERVATION AGE
Cells with obs > 6h are marked low-confidence on regional maps.
 SATELLITE COVERAGE
Cells with < 70% satellite coverage receive automatic uncertainty flags.
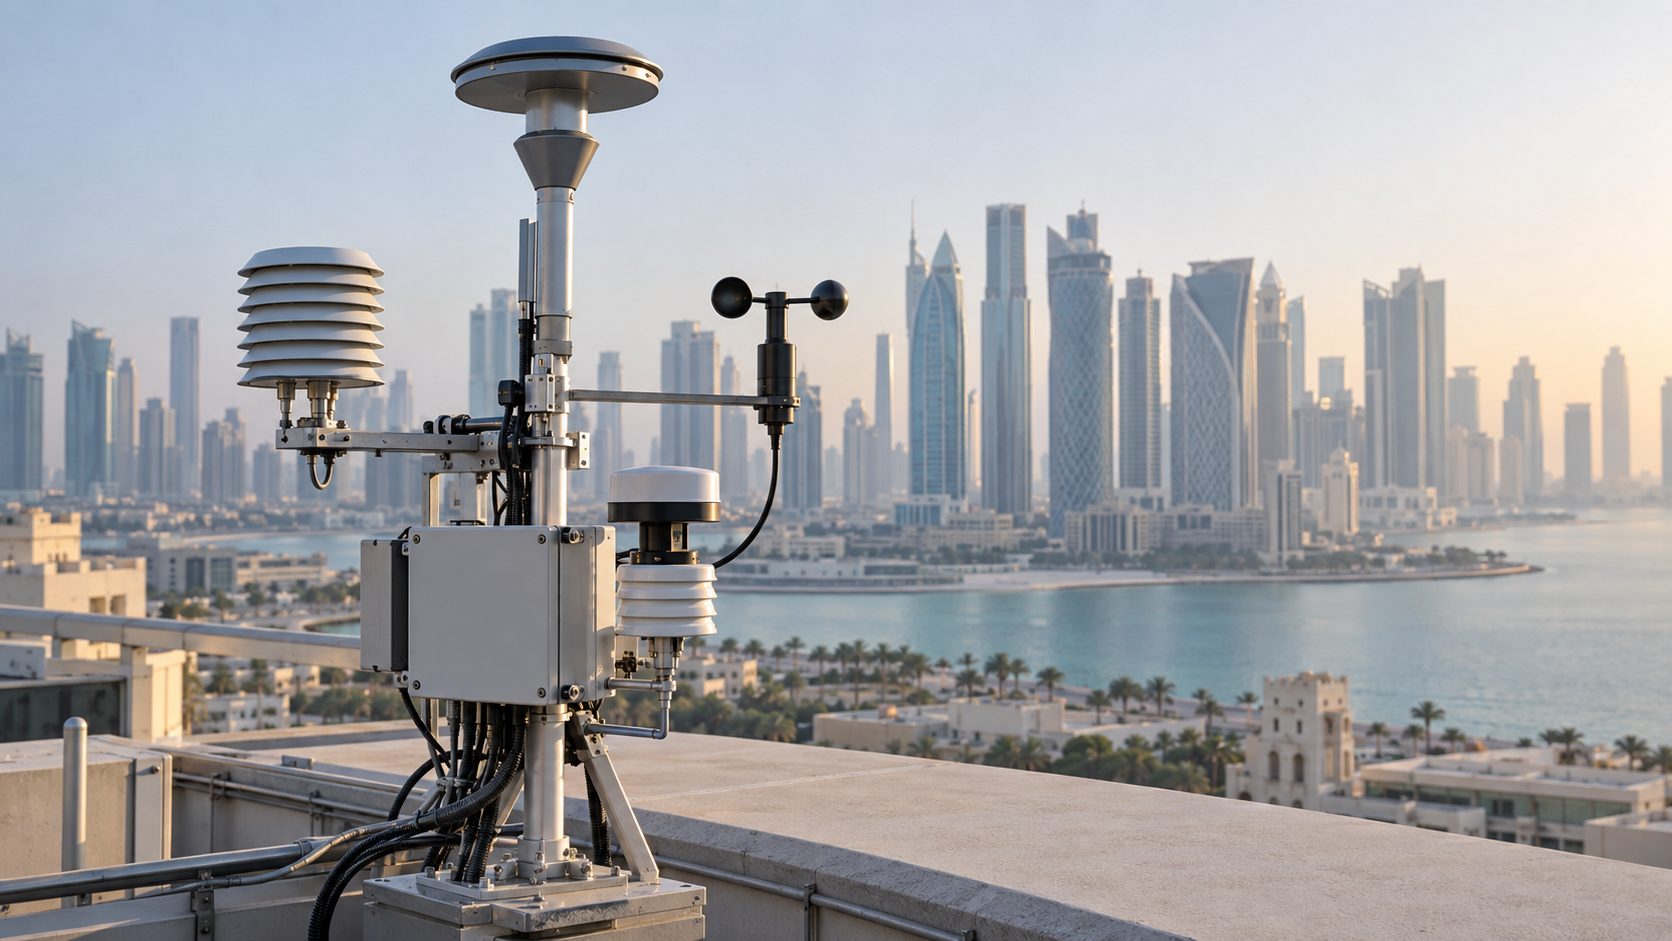 GROUND STATIONS
Zero-station cells cannot be validated and are clearly marked.
THE INFORMATION STACK
Availability is stated for every input. Missing site telemetry, irradiance readings, or atmospheric observations are identified rather than inferred.
A PRACTICAL WORKFLOW
The workflow keeps model context, field evidence and human approval in their proper places.
Omit bbox for the full Middle East grid.
overall_confidence = high / medium / low drives display logic.
obs_age_hours > 6 triggers automatic medium or low downgrade.
Remove or add visual uncertainty indicators before publishing.
Archive confidence grids to monitor sensor network health.
HOW INFORMATION BECOMES USEFUL
These are screening patterns, not automatic instructions. Operational thresholds and local advisories remain authoritative.
FOR PRODUCT TEAMS
The response exposes gaps and limitations so an application can explain confidence instead of hiding it.
/api/v1/air-quality/middle-east/confidence-gridGET /api/v1/air-quality/middle-east/confidence-grid
?resolution_km=25
&lat_min=23
&lat_max=26
&lon_min=54
&lon_max=56decision response{
"cell_count": 4,
"cells": [{
"cell_id": "ME_N1",
"label": "Abu Dhabi & Coast",
"obs_age_hours": 2.1,
"satellite_coverage_percent": 94,
"ground_stations_within_200km": 5,
"pm25_uncertainty_flag": "low",
"overall_confidence": "high"
}]
}CAPABILITY BOUNDARIES
BUILD RESPONSIBLY
Pair AtmosGrid’s regional weather context with local irradiance sensors, site telemetry and operator review.