AtmosGrid — Planetary IntelligenceCOMMERCIAL PRODUCT
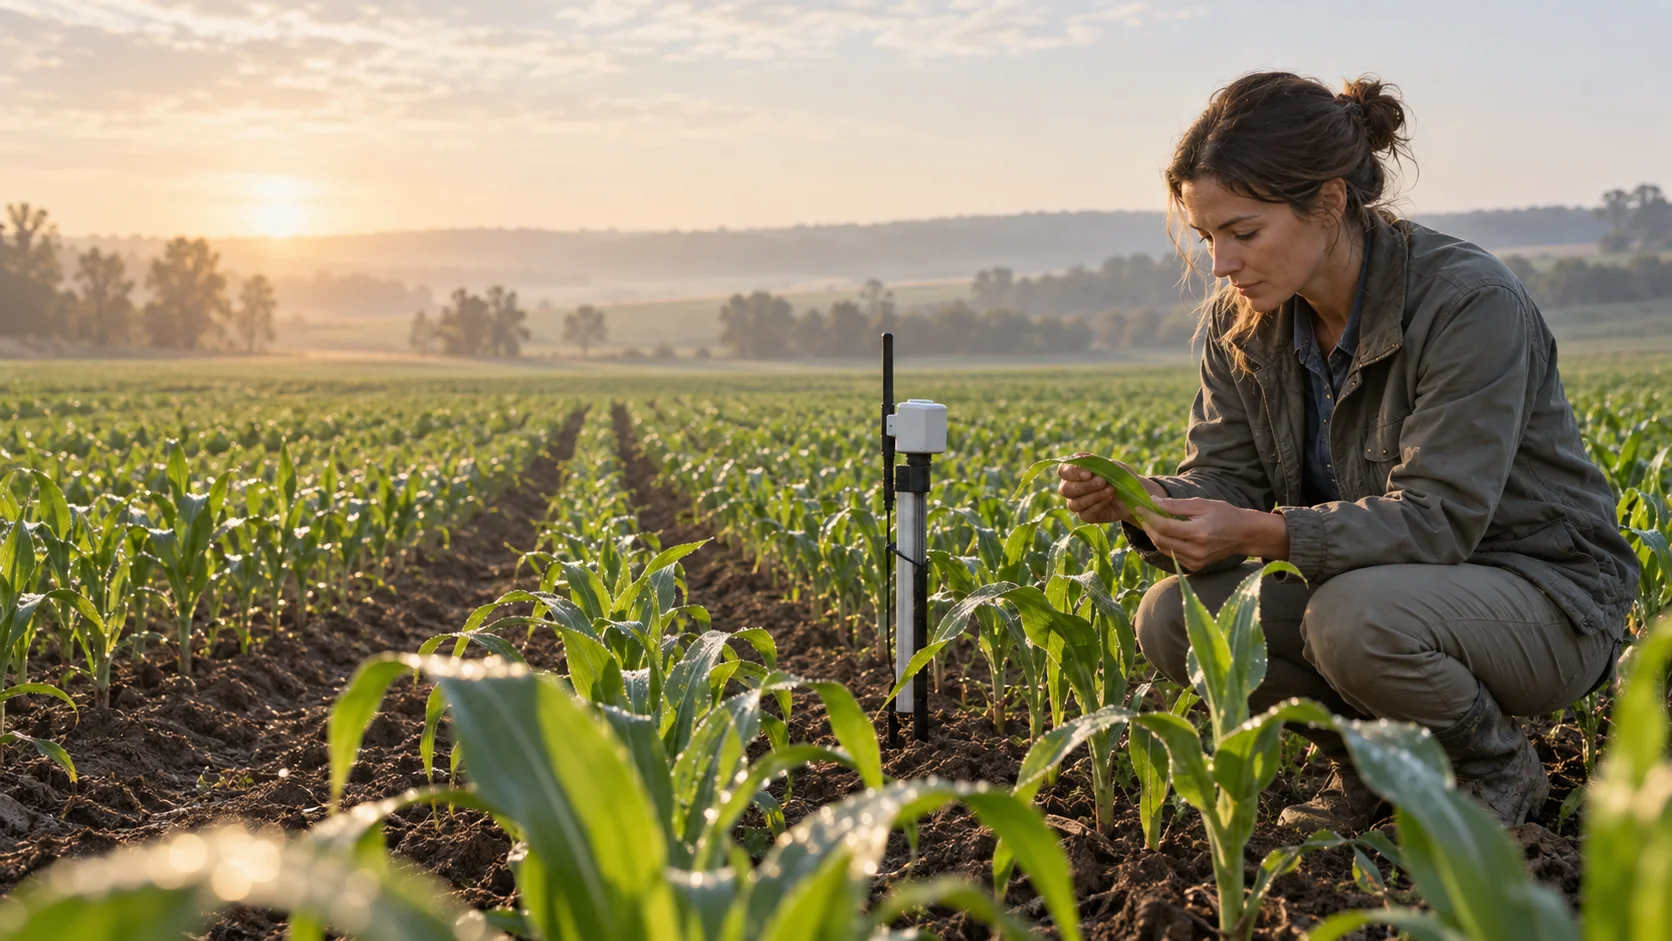
Agricultural landscape illustrating the crop decision workflow
← All crop tools

CROP DAMAGE FORECAST

A damage forecast should be measured—not guessed.

This capability is deliberately gated. See the evidence required for defensible parcel-level damage forecasting and how weather, imagery and field labels must work together.

DATA CONTRACT READY · MODEL DATA REQUIREDSee how it works ↓
Illustrative agriculture imagery

THE DECISION IT SUPPORTS

What evidence is required before a damage percentage can be trusted?

Weather exposure alone cannot prove damage. A defensible result requires a known parcel, crop and stage, a pre-event baseline, post-event observations and ground-truth labels.

Built for

  • Insurers and assessors
  • Government relief teams
  • Remote-sensing teams
  • Agricultural researchers

WHY TEAMS USE IT

Turn broad data into a clearer next step.

Each result is designed to narrow a decision, show the inputs behind it, and surface what must still be checked locally.

01

Prevent false precision

Return a data-required response instead of manufacturing a damage estimate.

02

Define the roadmap

Show the minimum datasets needed to move from exposure to validated damage.

03

Separate exposure and loss

A storm over a crop is not the same claim as confirmed physical damage.

04

Support auditability

Retain imagery dates, model version, field labels and uncertainty.

FROM REGION TO FIELD

See where each signal fits.

Images illustrate the operational setting. They are not live observations; use source timestamps and local measurements for decisions.
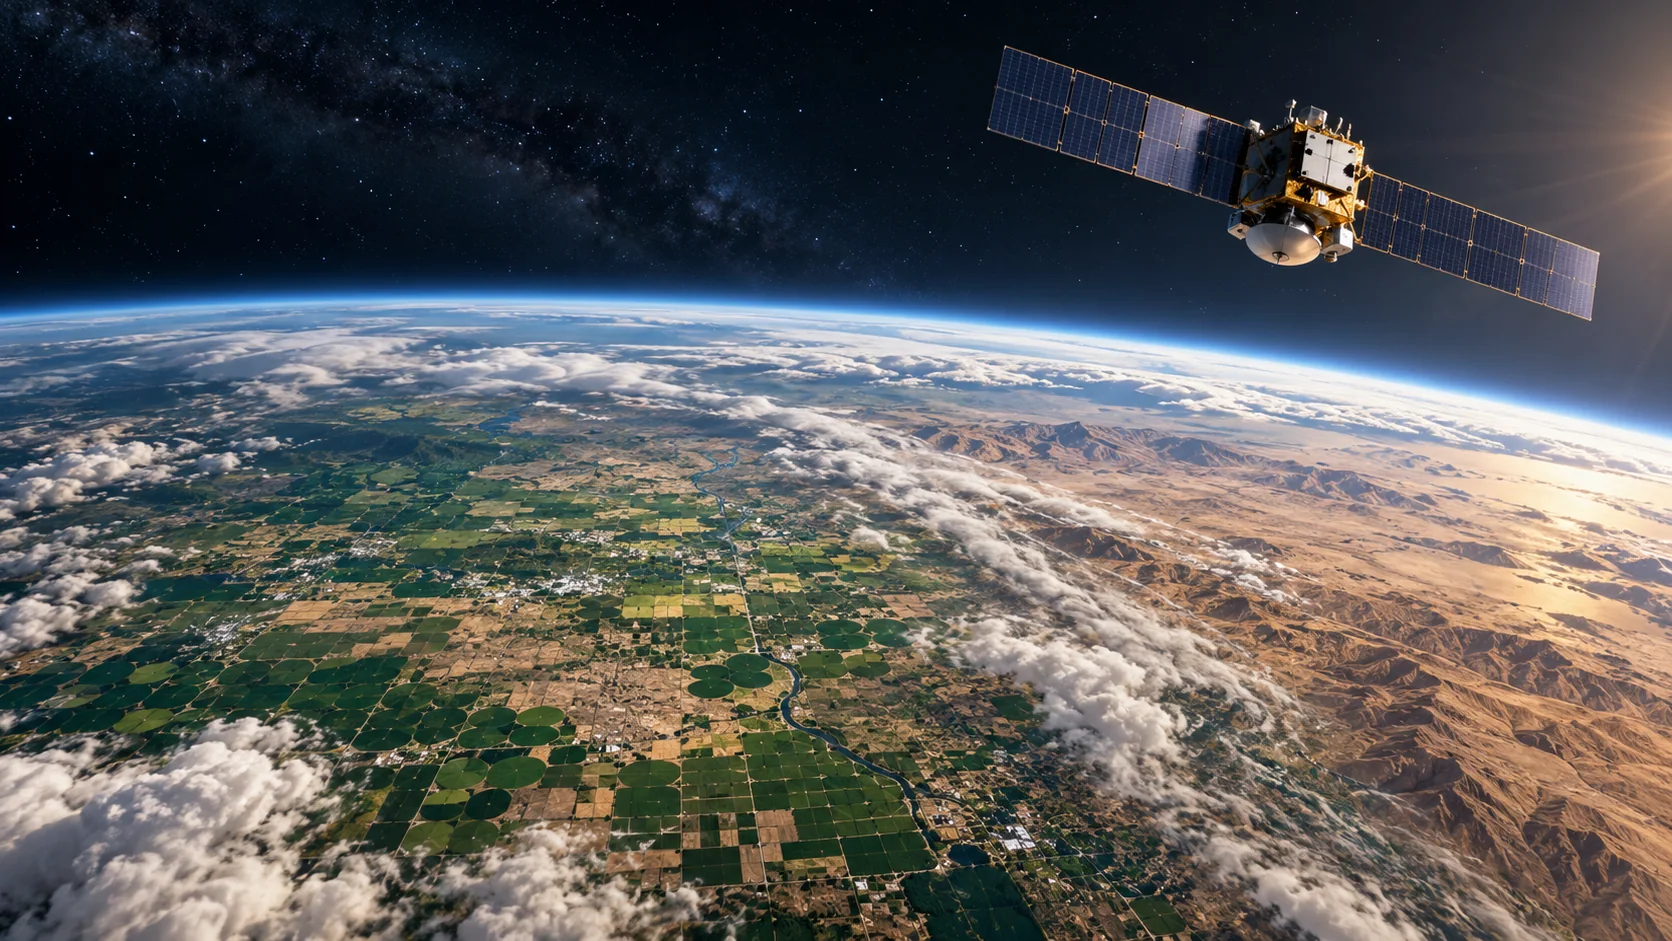
Establish before and afterCHANGE DETECTION

Establish before and after

Comparable imagery measures change rather than inferring it from a forecast.

Verify damage on the groundGROUND LABEL

Verify damage on the ground

Surveys connect spectral change to damage and separate it from harvest or management.
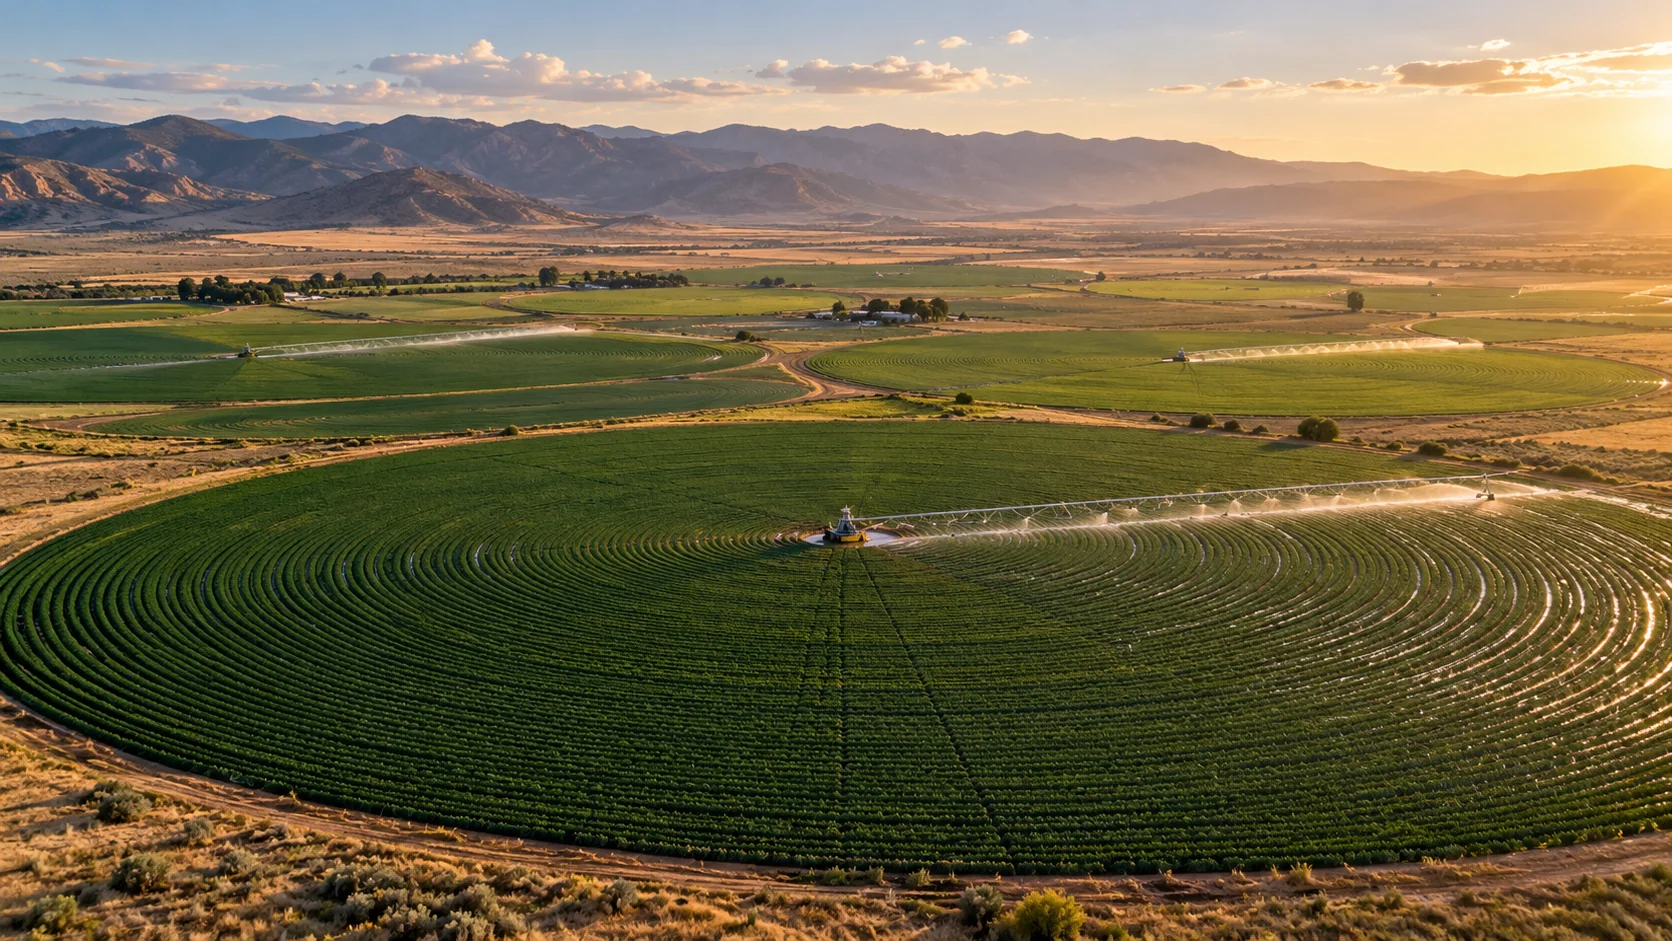
Know the assessment boundaryPARCEL CONTEXT

Know the assessment boundary

Field geometry keeps neighbouring crops from contaminating the estimate.

THE INFORMATION STACK

What goes in—and what it helps explain.

Availability is stated per input. AtmosGrid never converts a missing parcel observation into a made-up field value.

INFORMATIONSOURCEHOW IT IS USEDSTATUS
01Parcel boundaryFarmer / land recordDefines the assessed area.REQUIRED · MISSING
02Crop and stageField recordSets sensitivity and crop response.REQUIRED · MISSING
03Pre-event imageryOptical / SARBuilds the baseline.REQUIRED · MISSING
04Post-event imageryOptical / SARMeasures spatial change.REQUIRED · MISSING
05Weather exposureAtmosGridDescribes the hazard mechanism.PARTIAL
06Ground-truth labelsSurvey / claimsTrains and validates damage.REQUIRED · MISSING

A PRACTICAL WORKFLOW

From input to reviewable decision.

The workflow keeps model context, field evidence and human approval in their proper places.

  1. 01

    Register parcel and crop

    Record geometry, variety, sowing date and stage.

  2. 02

    Build a baseline

    Select comparable quality-controlled observations.

  3. 03

    Characterise the hazard

    Attach exposure evidence with timestamps and provenance.

  4. 04

    Measure change

    Control for normal growth, harvest and management.

  5. 05

    Validate before publishing

    Use independent labels, uncertainty and human review.

HOW INFORMATION BECOMES USEFUL

Examples of decisions it can inform.

These are screening patterns, not automatic instructions. Operational thresholds and local advisories remain authoritative.

SCENARIO 01

Cyclone over standing crop

Signal
Exposure plus verified canopy change.
Useful action
Prioritise parcels for assessment.
Check before acting
Exposure is not automatically damage.
SCENARIO 02

Flood after extreme rain

Signal
Inundation intersects a registered parcel.
Useful action
Queue inspection and evidence capture.
Check before acting
Duration, stage and drainage drive loss.
SCENARIO 03

Regional drought concern

Signal
Sustained anomaly against seasonal baseline.
Useful action
Select areas for yield checks.
Check before acting
Irrigation may explain anomalies.

FOR PRODUCT TEAMS

A transparent API contract.

The response exposes gaps and limitations so an application can explain confidence instead of hiding it.

POST/api/v1/agriculture/india/crop-damage-forecast

Example request

{
  "parcelId": "field-102",
  "cropId": "rice",
  "event": "flood"
}
JSONdecision response

Example response

{
  "error": {
    "code": "ADDITIONAL_DATA_REQUIRED",
    "message": "Parcel, crop stage, imagery
      and ground truth required"
  }
}

CAPABILITY BOUNDARIES

Useful now. Honest about what comes next.

Supported now

  • Machine-readable gated response
  • Documented evidence contract
  • Weather exposure context
  • Hazard/damage separation

Additional data required

  • Parcel boundaries and crop registry
  • Stage, variety and management history
  • Comparable pre/post optical or SAR imagery
  • Ground-truth damage labels
  • Validated uncertainty and governance

BUILD RESPONSIBLY

Use the result to focus attention—not replace field judgment.

Pair AtmosGrid’s regional weather context with local measurements, crop stage, variety guidance and qualified agricultural advice.

Read the API documentation ↗Open the India viewer ↗Explore all crop tools ↗